


Pericardial tamponade is a medical emergency that requires rapid recognition and intervention. Ultrasound is therefore the ideal tool for helping make this diagnosis.
Sonographic Findings of Cardiac Tamponade
Multiple sonographic findings that can be identified in cardiac tamponade have been discussed in prior Critical Care Ultrasound entries, including RA systolic collapse (earliest sonographic sign), plethoric IVC, and right ventricular diastolic collapse (highly specific). Measurement of mitral inflow velocity variation is an additional ultrasound technique with diagnostic benefit in the evaluation of cardiac tamponade.
Right ventricle (RV) collapse typically occurs in diastole when RV intracavity pressures are at their lowest and least able to resist increased intrapericardial pressure. This sonographic sign is highly specific for cardiac tamponade (75-90%), but has a lower sensitivity (48-60%). Right atrial (RA) collapse is seen in RV systole also at its lowest intracavitary pressure, and is a sensitive but not specific sign. The absence of both RV and RA collapse has a 90% negative predictive value for tamponade.1,2 Mitral inflow velocity variation provides an alternate method of diagnostic evaluation. Pulsus paradoxus itself, measured via sphygmomanometry (blood pressure cuff), has a sensitivity of 98% and specificity of 83% when using a cutoff of >12 mmHg change.3,4 Detecting pulsus paradoxus via ultrasound is thus a useful tool for identification of cardiac tamponade.
Underlying Physiology
Mitral inflow velocity variation is the sonographic equivalent of pulsus paradoxus. Let’s review the underlying physiology to aid in understanding this finding. Cardiac tamponade results from the accumulation of fluid in the pericardial space that then compresses the low-pressure chambers of the heart and restricts their normal filling. As the inward pericardial pressure exerted on the RV increases, the RV can no longer expand outward into this space as it typically does, and instead moves into the left ventricle (LV) and inhibits LV filling, a consequence of a phenomenon called ventricular interdependence (Fig. 1).2
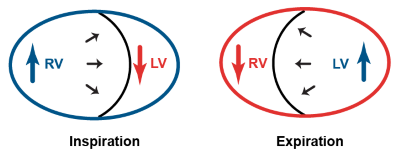
Fig. 1. Ventricular interdependence
Ventricular interdependence is a physiologic phenomenon that is exaggerated in cardiac tamponade. The two sides of the heart sit within the same enclosed pericardial sac, and thus compete for space. During inspiration, the negative intrathoracic pressure produced increases systemic venous return, leading to increased RV filling pressures, which must move further into the LV, decreasing LV filling as the RV outcompetes the LV for space within the limited pericardium. Conversely, during expiration, the positive intrathoracic pressure produces decreased venous return, leading to decreased RV filling, allowing the LV to fill with less competition (Fig. 2).5
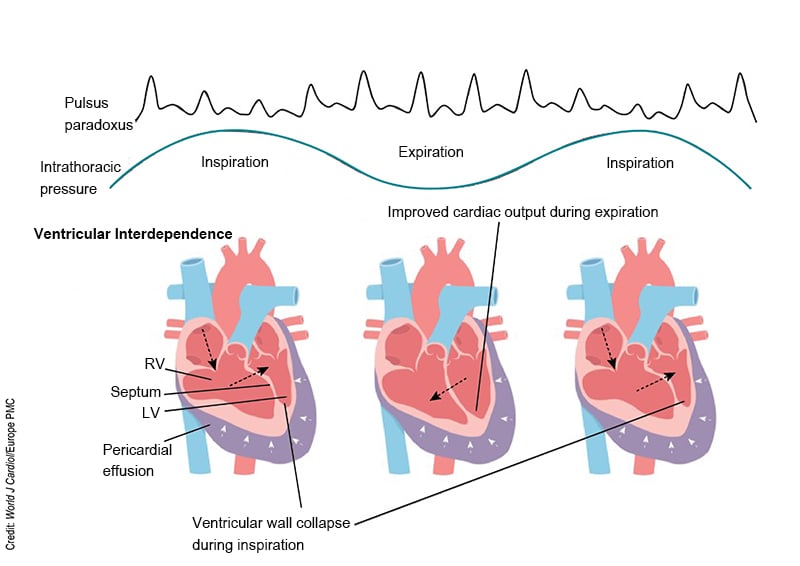
Figure 2. Pathophysiology of cardiac tamponade5
Concept of Mitral Inflow Velocity Variation
Mitral inflow velocity variation sonographically evaluates the speed of blood flow through the mitral valve across the respiratory cycle.6,7 It utilizes pulse wave Doppler, which sends sound waves in a pulsed fashion allowing for measures of the velocity of blood within the sample gate. This exam can assess for exaggerated ventricular interdependence during the respiratory cycle (sonographic pulsus paradoxus) by detecting changes in flow velocity across the mitral valve during expiration and inspiration that are excessive. As pre-load increases during inspiration leading to increased RV filling, the RV bows further into the LV impairing its filling, decreasing the mitral inflow velocity.1,2
Ventricular interdependence is physiologic, but causes a variation of no more than 5-10% of the cardiac output in the absence of tamponade.8 The percentage of change that defines abnormal varies across different studies, however a commonly accepted number is a >25% decrease in MV inflow velocity as a diagnostic sonographic criteria.2,10,11 It is important to note that this is not specific to cardiac tamponade, as it can also occur in otherwise dyspneic patients – including those with asthma/COPD exacerbations or massive PE;1,9 however, in general these cases will not be accompanied by a pericardial effusion.
Overview of Mitral Inflow Doppler Waveforms
In echocardiography, E and A waves refer to specific components of the atrial inflow pattern, representing the velocities of blood flowing from the left atrium to the left ventricle. The E-wave corresponds to early passive diastolic filling and is the first wave seen on an inflow tracing. The A-wave represents late diastolic filling caused by atrial contraction and follows the E-wave. These wave tracings are crucial when assessing diastolic dysfunction, as changes in the timing, amplitude, or morphology of these waves can signify various abnormalities in ventricular filling. In normal filling patterns, the E wave is typically larger than the A-wave. In cardiac tamponade, accumulation of fluid in the pericardial sac compresses the heart, impairing diastolic filling. Consequently, E- and A-wave patterns may demonstrate equalization or even reversal, indicating increased right atrial pressure and impaired ventricular filling.
Measuring Mitral Inflow Velocity Variation
Changes in mitral flow velocity during inspiration and expiration are much larger in cardiac tamponade than in a normal cardiac cycle,12 and the goal of this ultrasound technique is to quantify the percent change. MV inflow velocity is measured using pulsed wave Doppler in the apical 4-chamber view, with the gate placed at the tips of the mitral valve leaflets. Movement of the heart in pericardial fluid or from respirations may affect accurate measurement of these flow patterns and should be minimized. (Fig. 3)
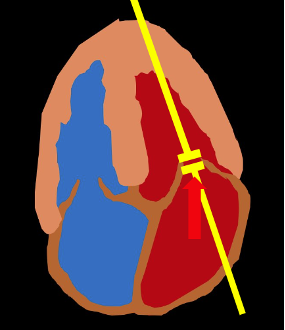
Figure 3. Measuring mitral inflow velocity variation
Flow velocity variation should be measured by comparing the tallest E-wave peak (during early expiration) to the lowest E-wave peak (during early inspiration); see Fig. 4.1 The percentage of respiratory variation for mitral inflow is calculated as [expiratory E-wave height - inspiratory E-wave height]/expiratory E-wave height.10 A difference of >25% is typically considered diagnostic of tamponade in the setting of pericardial effusion.2,10,11 Importantly, measurement is unreliable in the setting of atrial fibrillation.
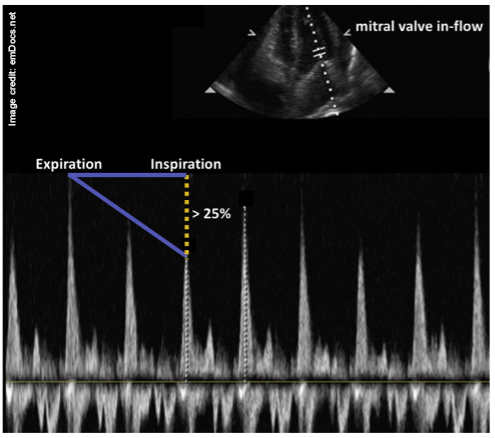
Figure 4. Pulse wave Doppler measuring respiratory cycle changes in the MV inflow velocity as a surrogate for pulsus paradoxus. In the A4C view, the gate is placed at the tips of the valve leaflets. The flow velocities should be measured at the first heartbeat after the change in respiratory phase. In other words, sample the tallest E-wave peak and compare it to the lowest. (Credit: Alerhand S et al., emDocs.net)
References
- Alerhand S, Carter JM. What echocardiographic findings suggest a pericardial effusion is causing tamponade?. Am J Emerg Med. 2019;37(2):321-326.
- Perez-Casares A, Cesar S, Brunet-Garcia L, Sanchez-de-Toledo J. Echocardiographic Evaluation of Pericardial Effusion and Cardiac Tamponade. Front Pediatr. 2017;5:79.
- Roy CL, Minor MA, Brookhart MA, Choudhry NK. Does This Patient With a Pericardial Effusion Have Cardiac Tamponade? JAMA. 2007;297(16):1810–1818.
- Curtiss EI, Reddy PS, Uretsky BF, Cecchetti AA. Pulsus paradoxus: definition and relation to the severity of cardiac tamponade. Am Heart J. 1988;115(2):391-398.
- Prabhakar Y, Goyal A, Khalid N, Sharma N, Nayyar R, Spodick DH, Chhabra L. Pericardial decompression syndrome: a comprehensive review. World J Cardiol. 2019;11(12):282-291.
- Appleton CP, Hatle LK, Popp RL. Cardiac tamponade and pericardial effusion: respiratory variation in transvalvular flow velocities studied by Doppler echocardiography. J Am Coll Cardiol. 1988;11(5):1020-1030.
- Leeman DE, Levine MJ, Come PC. Doppler echocardiography in cardiac tamponade: exaggerated respiratory variation in transvalvular blood flow velocity integrals. J Am Coll Cardiol. 1988;11(3):572-578.
- Bull RK, Edwards PD, Dixon AK. CT dimensions of the normal pericardium. Br J Radiol. 1998;71:923-925.
- Hoit BD, Shaw D. The paradoxical pulse in tamponade: mechanisms and echocardiographic correlates. Echocardiography. 1994;11(5): 477-487.
- Zhang S, Kerins DM, Byrd BF 3rd. Doppler echocardiography in cardiac tamponade and constrictive pericarditis. Echocardiography. 1994;11(5):507-521.
- Duanmu Y, Choi DS, Tracy S, et al. Development and validation of a novel prediction score for cardiac tamponade in emergency department patients with pericardial effusion. Eur Heart J Acute Cardiovasc Care. 2021;10(5):542-549.
- Tabata T, Kabbani SS, Murray RD, Thomas JD, Abdalla I, Klein AL. Difference in the respiratory variation between pulmonary venous and mitral inflow Doppler velocities in patients with constrictive pericarditis with and without atrial fibrillation. J Am Coll Cardiol. 2001;37(7):1936-1942.