Taking into account the negative space, we have a more complete picture of the positive and negative effects of treatment and can make more informed decisions with our patients.
The writers at theNNT.com are trying to reshape the way we look at statistics. The new wave of emergency medicine physicians is trained around the principle of evidence-based medicine. Free online access medicine (FOAM) is revolutionizing the way we access expert opinion on a variety of topics. From critical care to ultrasound, leaders in their respective fields are discussing new and innovative ways to practice. TheNNT.com represents one of these innovations. Expertise found on theNNT.com is in the area of literature analysis. Expert contributors include Drs. David Newman and Ashley Shreves of Mount Sinai Medical Center, Gary Green at UCSF, Koustav Mukherjee at Bronx-Lebanon, Joshua Quaas at Mount Sinai-St. Lukes, Daniel Runde at University of Iowa, Graham Walker at Stanford University, and Shariar Zehtabchi at SUNY Downstate Medical Center. All of the contributors are EM physicians dedicated to providing patient-centered data on relevant topics in a consistent, easy to use, and understandable format.
The Negative Space
The argument for using theNNT.com as your primary statistics source is a compelling one. As is apparent, the site is based on the number needed to treat (NNT) and discusses the attributed risk reduction; therefore, it does not exaggerate the true impact of your intervention. I recently sat down with David Newman, one of the cofounders of theNNT.com website. He revealed to me that the NNT as a statistic is about incorporating negative space. To make his point, he referred to the famous Henri Matisse painting, La Danse (Image 1).
When initially presented with this metaphor, I was lost. Art history is not a prerequisite for medical school, and I would be surprised if the topic made it on to board exams. When asked to describe the painting, I naively said that it is a painting focused on five dancers. It turns out I was not seeing the complete picture. The true artistry of the painting lies in its use of negative space (the sky and mountains that border the dancers). Similarly, in medical literature we focus heavily on statistics, like relative-risk reduction, without seeing the full context that incorporates the rest of the data. We focus on the dancers, and ignore the majority of the painting. The tutorial on theNNT.com asks us to imagine a theoretical new drug that has been shown to have a 20% relative-risk reduction. As health care providers, we get very excited about numbers like this. If we can reduce someone's morbidity or mortality by 20%, it would be irresponsible not to, right? What theNNT.com attempts to do is put that number back into its full context or, in other words, to reclaim the negative space. Imagine a drug that, when compared to a placebo, reduces the risk of morbidity from 10% to 8%. This statistically significant relative risk-reduction of 20% only affects 2% of the population. Reporting this number as a 20% risk reduction is not false, but completely ignores the negative space — the whopping 90% of the population who are unaffected regardless of the intervention.
The Math
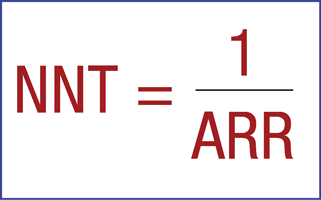
If we take a look at the way the number needed to treat is calculated (Figure 1), you begin to understand why it is thought to be a more accurate indication of the data set as a whole. Harkening back to statistics (and without causing too much PTSD from board review), the NNT is calculated by 1/ARR (absolute-risk reduction). The ARR is calculated by the control event rate minus the experimental event rate (CER-EER). This is where the NNT gets its value. By creating a singular whole number that reflects the total number of patients needed to treat to prevent one adverse effect, it incorporates all of the negative space.
Now let's take a look at a real medication example — daily aspirin for primary prevention of heart attacks, strokes, and death. The 2009 Cochran review showed a 12% proportional-risk reduction. That is an impressive number, but what if we were to look at the NNT for this data? The study reports a reduction from 0.57% in the control group to 0.51% in the treatment group. This leads to an NNT of 1 in 1667 for any event, 1 in 2000 for prevention of a non-fatal heart attack, and 1 in 10,000 for preventing a non-fatal stroke. There were no prevented deaths. This means that 1667 people would need to be treated to prevent one event. 99.94% of patients would see no benefit. The 12% proportional reduction in risk, when put into a more complete picture, doesn't look as appealing as it once did. Like any statistic, the NNT is situation- and patient-population-specific. Let's take a look at the same drug, aspirin, in our emergency department population. Take a patient who presents to the ED with ST elevations. Using the NNT system for prescribing aspirin in this situation, the NNT goes from 1667 to 42. This means that only 42 people need to be treated to save one life. 2.3% of people treated will see a benefit – not insignificant in our business. As EM physicians, our role is to employ techniques that will have the most potential positive impact on the lives of our patients.
Easy to Understand Rating System
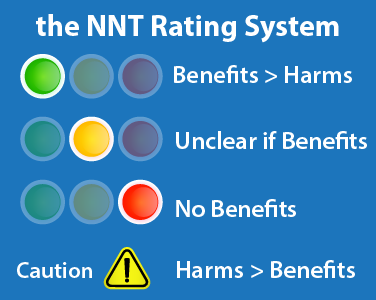
As residents, our time is very limited and learning and retaining information is a constant struggle. TheNNT.com has developed a simplified rating system (Figure 2) to help guide clinical decision making. A green recommendation means benefits outweigh harms. Yellow indicates a lack of clarity about the benefits and more clinical judgment should be used with the treatment. Red means no benefit, or benefits and harms balance out. And finally, a black recommendation warns that harms outweigh benefits. In the example discussed earlier, aspirin in the setting of a diagnosed MI is green, while aspirin for preventing a first heart attack or stroke is red. An example of a yellow recommendation would be anticoagulation for DVT, something we do every day. The NNT for this population was incalculable because in the only two small trials ever done, the drug showed no mortality benefit, while the number needed to harm (cause a major bleeding event) was between 50 and 100.
The NNT and Patient-Centered Care
How can these statistics be used to improve patient-centered care? As we move away from paternalistic medicine towards patient-centered medical care, we have to find a better, simpler way of communicating our knowledge base to our patients. The NNT can even help in this endeavor. Imagine you are working with a diabetic patient, trying to control their blood sugar. The authors at theNNT.com show that tight glycemic control (closely monitoring blood sugar with aggressive medical management) has surprisingly shown only one statistically significant effect. There was no added benefit for stroke prevention, heart attack, kidney failure, or prevention of death. The only significant finding in this five-year study was that for every 250 people treated, one limb amputation was prevented. The number needed to harm, on the other hand, was six. For every six people treated with tight glycemic control, one was hospitalized with a complication. These numbers seem to lean heavily against such tight monitoring and treatment. This, however, is where the doctoring comes in — a patient might be willing to risk a 1/6 chance of hospitalization to avoid a 1/250 chance of limb amputation. Understanding and using the NNT will make it easier for us to help our patients make informed choices based on their own values. As a profession, we are moving towards a more analytical way of thinking. We are asking ourselves not only ”œwhat should I do for this patient?” but also ”œwhat might I be doing for this patient?” Intervention may not always be the best answer. Taking into account the negative space, we have a more complete picture of the positive and negative effects of treatment and can make more informed decisions with our patients.


