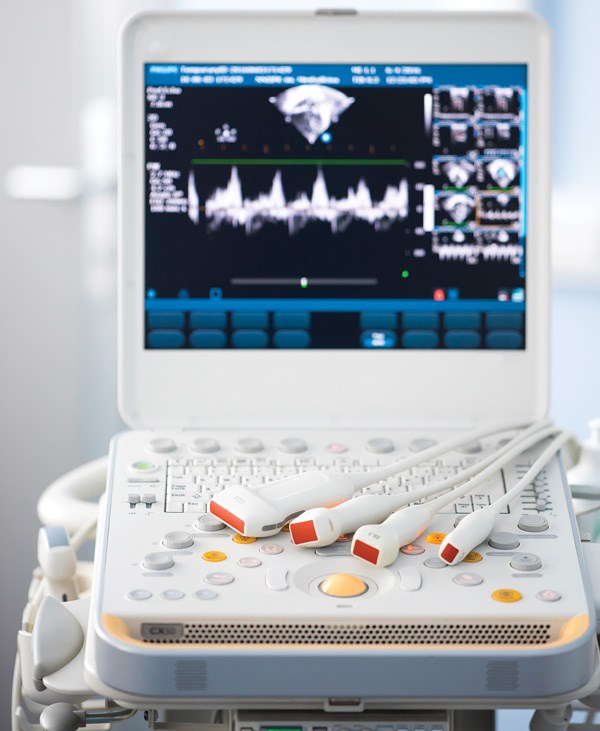
A 75-year-old male with a past medical history of congestive heart failure, diabetes mellitus, hypertension, and coronary artery disease presents to the emergency department (ED) with generalized weakness, shortness of breath, productive cough, and chills for the past three days. On arrival he is diaphoretic and ill-appearing but alert and following commands. Initial vital signs include blood pressure: 88/60 mmHg, heart rate: 126 BPM, rectal temperature: 99.0 F, respiratory rate: 22, oxygen saturation: 98% on room air. The patient has diminished breath sounds at the lung bases and 1+ pitting edema bilaterally to the knees. Initial labs reveal a leukocytosis of 14,000 with an 89% neutrophilic predominance, an elevated lactate of 3.0 and an elevated BNP of 4000. A portable chest x-ray reveals pulmonary vascular congestion and cannot exclude an underlying infiltrate.
The team correctly identifies that the patient is in shock; however, it is difficult to determine the etiology. With the most likely culprit being cardiogenic shock, vasodilatory shock, or some combination of the two, the team must determine the correct etiology in order to treat the patient appropriately. Resuscitation for cardiogenic shock may require administration of inotropic agents, diuresis, and respiratory support if necessary. Conversely, vasodilatory shock from sepsis necessitates fluid boluses, early administration of antibiotics, and possible administration of pressors.
Are there any diagnostic tools that can help differentiate shock in a timely and non-invasive manner? Have you considered measuring the patient's cardiac output with bedside ultrasound?
Many ED providers are familiar with gross assessment of systolic function either by visual estimation of the “squeeze” or by other techniques such as EPSS (E-Point Septal Separation).1 Here we will demonstrate how to calculate the cardiac output to provide objective data about cardiac function and volume status.
Definition of Cardiac Output
Cardiac output (CO) is the amount of blood pumped by the heart per minute, determined by the product of the stroke volume (SV) of the left ventricle, which is the volume of blood pumped per cardiac cycle, and the heart rate (HR).
CO (L/min) = SV (L/cycle) x HR
(cycle/min)
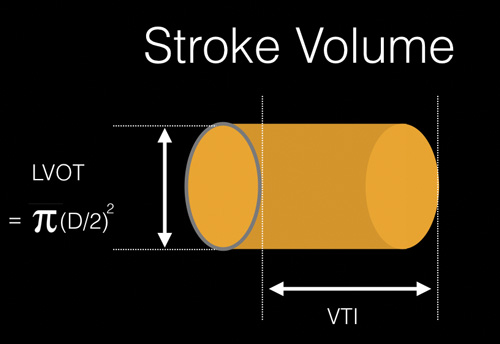 Figure 1. Estimation of the stroke volume using the LVOT diameter and VTI to calculate cylinder volume.
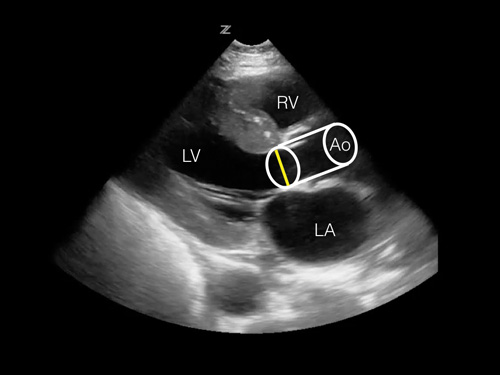 Figure 2. Projection of the estimated stroke volume cylinder onto the parasternal long axis view. The measured LVOT diameter can be seen as a yellow line. RV = right ventricle, LV = left ventricle, LA = left atrium, Ao = Aortic outflow tract.
In order to calculate stroke volume using ultrasound, we need two measurements of cardiac function: LVOT (left ventricular outflow tract) diameter and VTI (Velocity Time Integral). The LVOT diameter is used to estimate the area of the LVOT. The VTI, which is the mean velocity of blood traveling at a selected location over the time period of systole, is measured at the location of the LVOT.
Using these measurements, the volume of cylinder represents a column of blood traveling from the left ventricle to the aorta during systole. This is the stroke volume (Figures 1,2).
Technique for Measurements
LVOT diameter
Step 1: Using a low-frequency phased-array transducer, obtain a parasternal long axis view. Freeze the image during systole.
Step 2: Measure the LVOT anterior to the aortic valve leaflets (Figure 3).
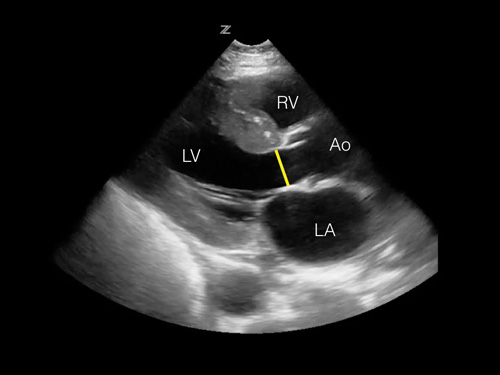 Figure 3. Image of parasternal long view with highlighted LVOT.
VTI
Step 1: Using the same phased-array transducer, obtain an apical 5-chamber view. Select Doppler mode and adjust the angle to coincide with the direction of blood flow (Figure 4).
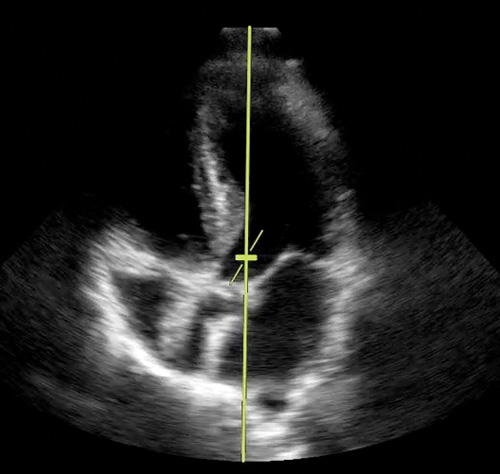 Figure 4. Image of apical 5-chamber with pulsed wave Doppler gate in position.
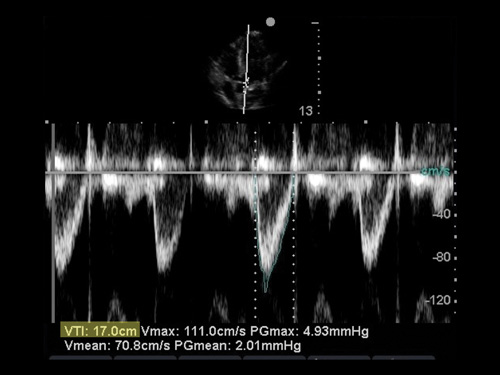 Figure 5. Image of pulse wave with tracing.
Step 2: Freeze your image. Trace the outline of one of the ejection waveforms. Depending on the model of ultrasound machine, VTI calculator functions may be enabled for this measurement (Figure 5).
The Evidence
Non-invasive measurement of cardiac output using ultrasound was first described in the literature in the 1980's.2-5 During this time, a number of studies demonstrated that Doppler measurements were comparable to other methods of determining cardiac output.6 Predominantly using animal models, correlation coefficients ranging from 0.87 to 0.99 were obtained when comparing measurements of cardiac output using ultrasound to then-established techniques including indicator dye dilution, the Fick method (the “gold standard”), and experimental in vivo pump monitoring.7-9
Subsequent investigations involving human subjects also showed remarkable agreement.10 Correlation coefficients ranging from 0.83 to 0.96 were obtained when comparing ultrasound measurements of cardiac output to thermodilution via Swan-Ganz catheter, pulsed Doppler, and Fick measurements during cardiac catheterization.4,11-13 In patients with aortic stenosis, two studies showed correlation coefficients to be 0.91 and 0.86 between pulsed Doppler and respective reference methods when the Doppler gate was placed in the LVOT proximal to the aortic stenosis.14,15 More recent studies by Lefrant et al. and Gentles et al. found correlation coefficients of 0.84 and 0.96, respectively, although these investigators obtained measurements of the VTI from the ascending aorta using a suprasternal view.16,17
Limitations
Sources of error associated with ultrasound-obtained cardiac output measurements are related to the operator, device limitations, and patient factors. Measuring the LVOT surface area using ultrasound assumes that the aortic outflow tract is circular. Realistically, the anatomical shape of the outflow tract is not a perfect circle, and its diameter is constantly changing due to elasticity of the muscular aortic wall. While the operator may attempt to measure the LVOT diameter during systole, this is not an exact point in time but a time period in which the aortic lumen can rapidly change size and shape. Therefore, multiple measurements of the LVOT diameter taken during systole can have similar but non-identical values.6
Turbulent blood flow across the aortic valve may also cause imprecise measurements when calculating the VTI. To ensure an accurate pulse wave is obtained, the Doppler gate should be oriented as parallel as possible to the direction of blood flow. Fortunately, this error can be somewhat forgiving, as less than twenty degrees of angulation between the gate and blood flow will produce only mild (<10%) deviations in velocity measurements.18 If a uniform column of blood is in parallel orientation with the Doppler gate, a pulse wave with an open black window at the base of the wave can be seen.
Intrinsic cardiac comorbidities altering hemodynamic function, such as valvular insufficiency or arrhythmia, pose a theoretical risk in obtaining an accurate measurement of cardiac output using ultrasound. Studies have shown ultrasound to be effective in evaluating cardiac output for patients with aortic stenosis, however there is a lack of data assessing cardiac output in significant valvular insufficiency and atrial fibrillation. For patients with atrial fibrillation, recommendations indicate that it is adequate to use the average value of five to ten cycles of the pulse wave when calculating VTI.18
Table 1. Cardiac Output Calculation Steps
| Calculation Steps | |
| Step 1 | Calculate the LVOT area: LVOT area (cm2) = [Ï€ x (LVOT diameter) 2]/ 4 |
| Step 2 | Determine the VTI (cm) |
| Step 3
| Calculate stroke volume by multiplying the LVOT area by the VTI. SV (cm3, or ml) = LVOT area (cm2) x VTI (cm) |
| Step 4
| Calculate cardiac output by multiplying the SV by the HR: CO (L/min) = SV (L/cycle) x HR (cycle/min) |
Table 2. Cardiac Output Calculation Steps
| Step 1 | LVOT area = [Ï€ x (LVOT diameter) 2]/ 4 = [Ï€ x (2.0 cm) 2]/ 4 = 3.14 cm2 |
| Step 2 | The calculated VTI is 20.0 cm |
| Step 3 | Stroke Volume = LVOT area (cm2) x VTI (cm) = 3.14 cm2 x 20.0 cm = 62.8 cm3, or 62.8 ml, or 0.0628 L |
| Step 4 | Cardiac Output (L/min) = Stroke volume (L/cycle) x HR (cycle/min) = 0.0628 (L/cycle) x 126 (cycle/min) = 7.9 L/min |
Case Resolution
Bedside ultrasound is performed on the patient using the methods described: his LVOT diameter is 2.0 cm and VTI is 20.0 cm (see Table 2).
The patient's cardiac output is calculated to be 7.9 L/min. Given the increased cardiac output (in contrast to an expected reduced cardiac output in acute systolic heart failure), vasodilatory shock secondary to sepsis from a likely pulmonary source was suspected. The patient was given a 30 cc/kg bolus of crystalloid and administered broad-spectrum antibiotics after blood cultures were drawn. Serial cardiac output measurements during the resuscitation trended to a normal value of 6.0 L/min. A repeat lactate was 1.6. The patient was closely monitored for volume overload and was eventually transferred to the step down unit for further management.
Bottom Line
Calculating cardiac output using bedside ultrasound can provide immediate objective data about cardiac function to aid in the diagnosis of specific shock states in order to guide treatment, particularly because treatment for one shock state may worsen another. Furthermore, monitoring changes in cardiac output can reflect volume status and accurately assess a patient's response to resuscitation.
References
- Carmody KA, Moore CL, Feller-Kopman DJ. Handbook of critical care and emergency ultrasound. Maidenhead: McGraw-Hill Medical, 2011.
- Haites NE, Mclennan FM, Mowat DH, Rawles JM. Assessment of cardiac output by the Doppler ultrasound technique alone. Heart. 1985;53(2):123-129.
- Fisher DC, et al. The mitral valve orifice method for noninvasive two-dimensional echo Doppler determinations of cardiac output. Circulation. 1983;67(4):872-877.
- Huntsman LL, et al. Noninvasive Doppler determination of cardiac output in man. Clinical validation. Circulation. 1983;67(3):593-602.
- Rawles J, Haites N. Doppler ultrasound measurement of cardiac output. Br J Hosp Med. 1984;31(4):292”“297.
- Schuster AH, Nanda NC. Doppler echocardiographic measurement of cardiac output: Comparison with a non-golden standard. The American Journal of Cardiology. 1984;53(1):257-259.
- Fisher DC, Sahn DJ, Friedman MJ, Larson D, Valdes-Cruz LM, Horowitz S, Goldberg SJ, Allen HD. The effect of variations on pulsed Doppler sampling site on calculation of cardiac output: an experimental study in open-chest dogs. Circulation. 1983;67:370-376.
- Colocousls JS, Huntsman LL, Currerl PW. Estimation of stroke volume changes by ultrasonic Doppler. Circulation. 1977;56:914-917.
- Stelngarf RM, Meller J, Barovlck J, Patterson R, Herman MV, Teichholz LE. Pulsed Doppler echocardiographic measurements of beat-to-beat changes in stroke volume in dogs. Circulation. 1980;62:542-548.
- Otto CM. Textbook of clinical echocardiography. Philadelphia, PA: Saunders/Elsevier, 2009.
- Magnin PA, Stewart JA, Yvers S, van Ramm 0, Kfsslo JA. Combined Doppler and phased-array echocardiographic estimation of cardiac output. Circulation. 1981;63:388-392.
- Lewis JF, Kuo LC, Nelson JG, Limacher MC, Quinones MA. Pulsed Doppler echocardiographic determination of stroke volume and cardiac output: clinical validation of two new methods using the apical window. Circulation. 1984;70(3):425-431.
- Bouchard A et al. Measurement of left ventricular stroke volume using continuous wave doppler echocardiography of the ascending aorta and M-mode echocardiography of the aortic valve. Journal of the American College of Cardiology. 1987;9(1):75-83.
- Otto CM et al. Experimental validation of Doppler echocardiographic measurement of volume flow through the stenotic aortic valve. Circulation. 1988;78(2):435-441.
- Burwash IG. Echocardiographic Evaluation of Aortic Stenosis ”“ Normal Flow and Low Flow Scenarios. European Cardiology Review. 2014;9(2):92.
- Gentles TL, Neutze JM, Caulder AL, Greene ER. Cardiac output measurements in congenital heart disease: validation of a simple, portable Doppler method. Journal of Ultrasound in Medicine. 2001;20(4):365-370.
- Lefrant JY, et al. CO assessment by suprasternal Doppler in critically ill patients: comparison with thermodilution. Intensive Care Medicine. 2000;26(6):693-697.
- Quiñones MA et al. Recommendations for quantification of Doppler echocardiography: A report from the Doppler quantification task force of the nomenclature and standards committee of the American Society of Echocardiography. Journal of the American Society of Echocardiography. 2002;15(2):167-184.


