


Arterial lines are helpful tools for monitoring hemodynamics and maintaining easy access for frequent lab draws in the critically ill patient. Interpreting the waveform of the arterial line is necessary for understanding how to use the data it provides to best take care of patients. Additionally, knowing how to troubleshoot a malfunctioning arterial line is a crucial skill for emergency medicine physicians.
Waveform Overview
The arterial line traces the pressure in the arterial circulation over time, allowing continuous measurement of the systolic pressure, diastolic pressure, and mean arterial pressure. Once the aortic valve opens, there is a rise in pressure up until it eventually peaks. This peak of the upstroke is the systolic blood pressure. The pressure begins to drop but rises briefly due to the retrograde flow caused by the aortic valve closing. The sudden slight increase in pressure is called the dicrotic notch on the waveform. After the dicrotic notch, the pressure drops until it reaches its lowest point, the diastolic blood pressure. The further the arterial line is from the aorta, the higher the systolic peak, the lower the end-diastolic pressure, and the greater the time between the systolic peak and the dicrotic notch (Image 1).1 It is important to note that the mean arterial pressure from the arterial line is calculated by measuring the area under the curve of the waveform. Additionally, it is helpful to understand how you can compare the readings from the A-line to the oscillometric blood pressure cuff. The arterial line will usually have a slightly higher systolic pressure, a slightly lower diastolic pressure and similar mean arterial pressures.

Image 1. Arterial waveform (Credit - Hallagan)
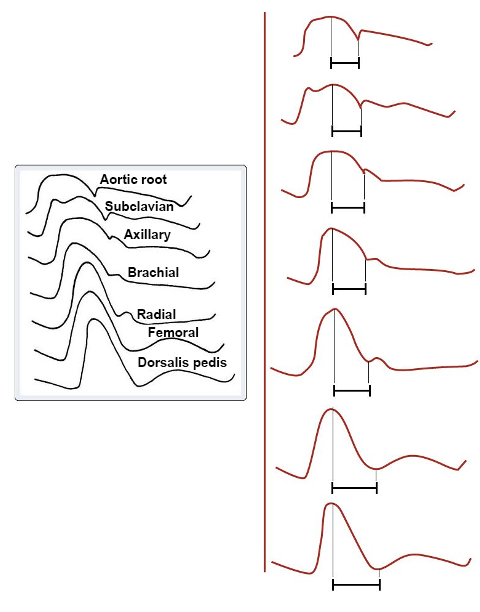
Image 2. Arterial waveforms at various locations (Credit - Yartsev)
Ensuring an Accurate Waveform
You've successfully established an arterial line on a critically ill patient; however, the nurse calls you to the bedside because they are struggling to obtain an accurate waveform. They report concern that the non-invasive blood pressure is significantly different from the arterial blood pressure.
What are your next steps?
Calibration
Transducer positioning: The transducer is the device that reads the fluctuations in pressure. In order to accurately measure arterial blood pressure, the system must be correctly set up and your transducer must be at the level of the phlebostatic axis. The phlebostatic axis is the reference point for zeroing an arterial line, and is defined as the fourth intercostal space at the level of the mid-axillary line, which correlates to the right atrium.2 If the transducer is positioned above the axis (patient's heart), it will produce falsely low blood pressure readings; conversely, if positioned below it will produce falsely high blood pressures.
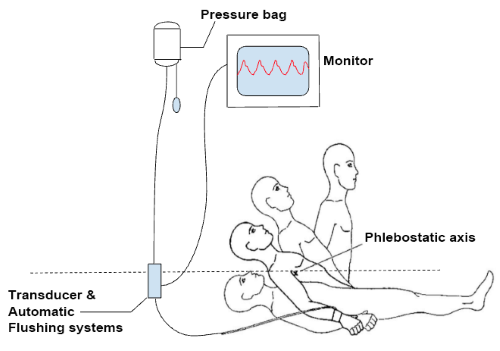
Image 3. Arterial line set-up (Credit - Hallagan)
Zeroing: Zeroing is necessary to provide the transducer with a reference point of pressure, which is most commonly atmospheric pressure. To zero the system, the stopcock is turned off to the patient and the cap is removed. This opens the transducer to the atmosphere. The "zero" button on the monitor is then pressed to indicate on the monitor that this is the zero reference pressure.3 When the monitor indicates that the zeroing process is complete, the cap is replaced and the stopcock is closed to the atmosphere.
Damping
Damping, or losing energy by dissipation, affects any oscillating system, including arterial lines.4 In the case of arterial lines, inappropriate damping causes inaccurate representations of a patient's systolic and diastolic blood pressure. Interestingly, the MAP should remain fairly accurate because the MAP is calculated as the area under the curve. The two primary ways damping affects arterial lines are underdamping and overdamping.
Under-damped (not enough energy lost):5
- Appearance: Systolic pressure overshot, abnormal oscillations during diastole
- Causes: Hypothermia, tachycardia, catheter artifact
- Results: Overestimation of systolic pressure, underestimation of diastolic pressure, wider pulse pressure
Over-damped (too much energy lost):
- Appearance: No characteristic landmarks, unusually smooth
- Causes: Air bubbles, kinks, clots, spasms, no volume or low pressure in pressure bag or tubing
- Results: Underestimation of systolic pressure, overestimation of diastolic pressure, narrower pulse pressure6
Fast Flush Test
In order to make sure your arterial line is not being over- or underdamped, you can perform a fast flush test, also known as the square waveform, or dynamic response test. To do this, rapidly flush the arterial line. You should see a square wave appear on the monitor. Release the flush valve and count the oscillations (sharp peaks) that you see before the arterial line returns to its baseline waveform. Ideally, there should be 1-2 oscillations before the waveform returns to normal. This indicates the appropriate amount of damping (Image 4). If there are 2 or more oscillations, the system is under-damped (Image 5). If there is less than 1 oscillation, the system is over-damped (Image 6).6
Steps to Perform the Fast Flush Test
- Pull transducer's flush
- Wait for square wave to appear on monitor
- Release the flush valve
- Count the oscillations (sharp peaks) before arterial line returns to its baseline waveform (Image 4)
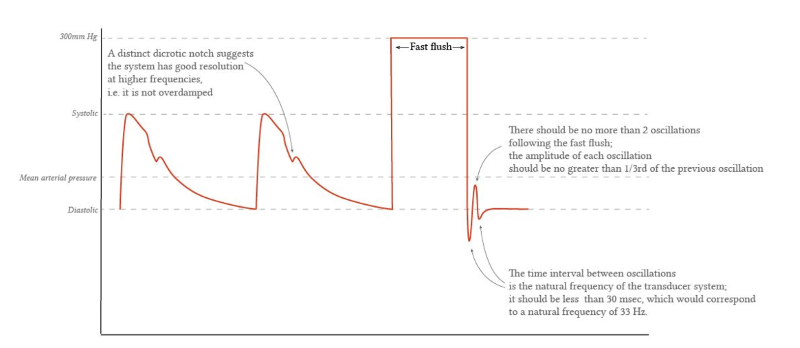
Image 4. Normal fast flush test (Credit - Yartsev)
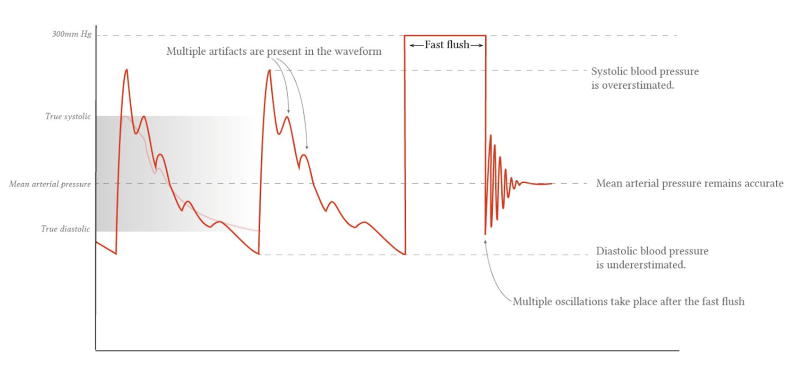
Image 5. Under-damped (Credit - Yartsev)
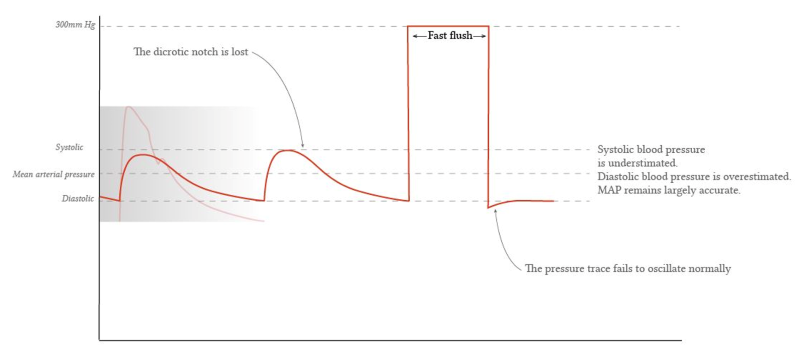
Image 6. Over-damped (Credit - Yartsev)
REFERENCES
- Weingart S. EMCrit 210.1 – Arterial Lines (Part 1). EMCrit Blog. Published on October 16, 2017. Accessed on April 23rd 2024. Available at: https://emcrit.org/emcrit/arterial-lines/.
- Nguyen Y, Bora V. Arterial Pressure Monitoring. [Updated 2023 Mar 19]. In: StatPearls [Internet]. Treasure Island (FL): StatPearls Publishing; 2024 Jan-. Available at: https://www.ncbi.nlm.nih.gov/books/NBK556127/.
- Tse B, Burbridge MA, Jaffe RA, Brock-Utne J. Inaccurate Blood Pressure Readings in the Intensive Care Unit: An Observational Study. Cureus. 2018 Dec 11;10(12):e3716.
- Saugel B, Kouz K, Meidert A, et al. How to measure blood pressure using an arterial catheter: a systematic 5-step approach. Crit Care. 2020;24:172 (2020).
- Escudier M, Atkins T, eds. A Dictionary of Medical Engineering. 2nd ed. 2019. Oxford University Press.
- Rezaie S. Damping and Arterial Lines. REBEL EM. July 4, 2022. Available at: https://rebelem.com/damping-and-arterial-lines/.
- Yartsev A. Arterial Line Dynamic Response Testing. Deranged Phsyiology. Dec. 18, 2023. Available at: https://derangedphysiology.com/main/cicm-primary-exam/required-reading/cardiovascular-system/Chapter%20759/arterial-line-dynamic-response-testing.
- Yartsev A. Normal Arterial Line Waveforms. Deranged Physiology. Dec. 18, 2023. Available at: https://derangedphysiology.com/main/cicm-primary-exam/required-reading/cardiovascular-system/Chapter%20760/normal-arterial-line-waveforms.