


A 70-year-old man with a history of coronary artery disease, hypertension, hyperlipidemia, and diabetes is brought to the resuscitation bay with severe dyspnea. The patient is in distress, tachycardic, and borderline hypotensive. You stabilize the airway, and the next question becomes what to do about his hemodynamic assessment.
Transthoracic echocardiography (TTE) is an essential tool in the resuscitation of hemodynamically unstable patients. Currently, global assessments of ejection fraction, right heart strain, and pericardial effusion are well-established methods in the practice of emergency medicine. Often, the point-of-care studies are limited to dichotomous answers like the presence or absence of right heart strain or the presence or absence of pericardial effusion. What hasn't been widely propagated is the use of advanced echocardiographic techniques like spectral Doppler (ie, pulsed wave and continuous), color Doppler, or M-mode to manage the heart-lung interactions as they evolve in the critically ill patient. The goal of this piece is to give a brief overview of the advanced echocardiographic techniques we can employ to resuscitate our sickest patients.
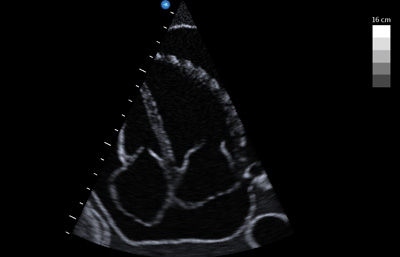 Figure 1. Large pericardial effusion suggestive of tamponade physiology.
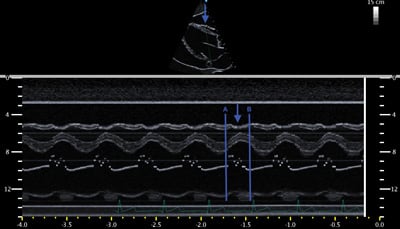 Figure 2. Diastolic collapse of the RV free wall (blue arrows). Points A and B demarcate diastole (ie, time during which mitral valve is open). The blue arrow indicates the collapse of the RV free wall during diastole.
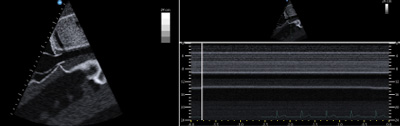 Figure 3. Inferior vena cava showing lack of variation with respiratory efforts.
Left: B mode showing static IVC.
Right: M mode showing lack in respiratory variation of IVC.
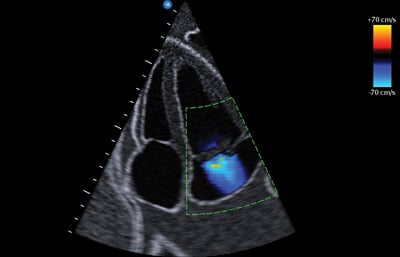 Figure 4. Color Doppler with Nyquist limit on right of the figure.
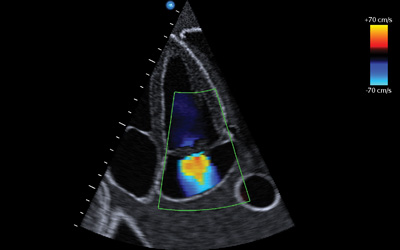 Figure 5. Centrally located mitral regurgitation jet.
Case 1. Transthoracic echocardiography shows a large pericardial effusion. Could this patient have tamponade physiology causing the symptoms? What signs do you look for to help determine the presence of tamponade physiology?
Beck's triad was discovered and integrated into medical training during the 1930s when surgical causes of acute tamponade were the most prevalent.1 Because the spectrum from pericardial effusion to physiologic tamponade covers various etiologies (eg, idiopathic, malignant, purulent, uremic, etc.), the physical exam findings of dissection-related tamponade of Dr. Beck's era are less reliable in current practice.1 Slowly accumulating “medical tamponade” will often lack the jugular venous distension or muffled heart sounds of an acute bleed into the pericardium. Patients exhibiting tamponade physiology are not always in shock but may have relative hypotension, making their diagnosis more subtle and difficult to detect. Furthermore, the classic pulsus paradoxus finding via manual sphygmomanometer is cumbersome and time-consuming to perform.
Described by Kussmaul in 1873, pulsus paradoxus is the classic sign of tamponade in which the equalization of intrapericardial pressures compromise cardiac output during inspiration. This manifests with a systolic blood pressure drop by greater than 10 mmHg with inspiration.1 During normal inspiration, the negative intrathoracic pressure increases preload/venous return to the right ventricle (RV). Normally, the increase in volume to the RV causes expansion into the pericardium without significant deviation of the interventricular septum into the left ventricle (LV). In tamponade physiology, the constriction and pressure equalization from the effusion inhibits the RV from expanding into the pericardium. Therefore, the septum is pushed leftward, impinging on the LV decreasing cardiac output and systolic blood pressure.2 This creates the phenomenon of pulsus paradoxus and the systolic blood pressure drop with inspiration exhibiting key concept in tamponade physiology: ventricular interdependence. This interaction between the right and left sides of the heart is seen in normal states, but exaggerated in tamponade as the two ventricles work in an increasingly confined pericardial space (Figure 1). Ultrasound visualizes and quantifies the tamponade-induced changes in flow.
The definition of tamponade has changed considerably over the past two decades as detailed in Catherine Otto's “The Clinical Practice of Echocardiography.”4 Though the signs of tamponade vary depending on the definition du jour, the most useful immediate sign of acute elevation in intrapericardial pressure is RV diastolic collapse - a specific sign reflecting the intrapericardial pressure elevation precluding adequate ventricular filling. A simple memory aid for tamponade findings on echo is to ask, “Is the RV collapsing during a time when it is supposed to be expanding?” The most commonly used view to document diastolic RV collapse is the parasternal long view. It may be difficult to differentiate between systolic and diastolic movement of the free RV wall by visualization in B-mode. This is when M-mode provides a clearer analysis, allowing simultaneous visualization of the free RV wall and anterior leaflet of the mitral valve. The opening of the mitral valve composed of the E-wave (early diastole) and A-wave (atrial kick) mark diastole. The blue arrow in Figure 2 indicates the inward movement or collapse of the RV free wall during the time between points A and B demarcating diastole (the time when the RV should be moving outward or expanding).
Additional echocardiographic evidence of tamponade physiology is mitral Doppler flow changes with inspiration. Simply put, mitral flow changes on Doppler reflect the pulsus paradoxus phenomenon. Mitral inflow velocity is blunted as inspiratory flow of venous return into the right heart pushes the septum into the left heart; Doppler flow across the mitral valve is therefore decreased. This is measured in the apical four-chamber view of the heart with the gate of the pulsed wave Doppler placed at the tip of the mitral valve. Normally, there is some minor respiratory variation in flow velocity, but this normal respiratory variation is exaggerated in tamponade. A drop of greater than 25% in mitral valve inflow velocity is consistent with tamponade physiology. This represents a sonographic version of pulsus paradoxus.
As a direct corollary, Doppler evaluation of the flow across the tricuspid valve and within the hepatic veins shows similar physiologic changes in response to the exaggerated ventricular interdependence.4 Expiration in the setting of tamponade amplifies the normal increase in pulmonary venous return to the left heart. This amplification pushes the septum into the right heart, resulting in hepatic vein flow reversal and decreased flow across the tricuspid valve during expiration. Similar to the mitral valve, tamponade will show a 25% decrease in the trans-tricuspid velocities with expiration.5
While the overall theme of tamponade can be distilled down to acute elevations in intrapericardial pressures to a degree that inhibits normal hemodynamic function, advanced echocardiographic techniques are necessary to diagnose when the tipping point of elevated intrapericardial pressure has been reached and cardiac output has been significantly compromised. By using Doppler flow patterns over serial exams, tamponade physiology can be more completely characterized beyond solely RV free wall diastolic collapse. Equalization of the intrapericardial pressures affects the downstream right atrial pressure commonly producing signs like a static inferior vena cava seen using M mode (Figure 3). As the intrapericardial pressures increase in tamponade, the flow across cardiac chambers becomes increasingly sensitive to respiratory cycle changes. The Doppler signals in surrounding areas like the IVC and hepatic vessels and across the tricuspid and mitral valve shows characteristic changes in the evolution of pericardial effusion to physiologic tamponade.4
Case 2. A different patient with the same clinical presentation has an echo that reveals a hyperdynamic LV with abnormal movement of the mitral valve. What tools can be used to assess for valvular pathology?
The same clinical presentation with very a different ultrasound finding can significantly alter management. In this patient, instead of tamponade, we are concerned for valvular catastrophe causing cardiogenic shock. With the finer details of Doppler beyond the scope of this review, the basics of color Doppler for valvular pathology can assist in identification of valvular dysfunction and inform the physician of its emergent diagnosis.
Moving away from the physiologic musings of tamponade, the color Doppler evaluation of valvular pathology requires a basic understanding of the sonographic mechanics. The color Doppler setting represents flow using a color spectrum to denote the direction of blood flow in relation to the ultrasound probe. Flow away from the transducer registers as blue; flow toward the transducer registers as red.6 Similar to pulsed-wave Doppler, color Doppler emits intermittent ultrasound signals to sample a specific area of blood flow. Because the machine can only send signals at a finite rate, both color Doppler and pulsed-wave Doppler have an upper limit of flow velocity at which the machine can accurately detect direction and velocity. This limit is known as the Nyquist limit. When the velocity of the blood flow in the sampled area exceeds the Nyquist limit, the machine reports the direction inaccurately, often in the opposite direction of the flow. The multi-colored artifact created is known as aliasing (Figure 4).
Turbulent flow velocity caused by regurgitation is much faster than normal laminar flow through a valve. Therefore, the aliasing artifact is used to identify regurgitant jets as the velocity of turbulent flow from regurgitation exceeds the Nyquist limit. Despite knowledge of aliasing in the regurgitant jet, we want to minimize overestimation of regurgitation due to an inappropriately low Nyquist limit. An inappropriately low Nyquist limit will overestimate the regurgitant jet by misinterpreting flow from the nearby pulmonary vein, incorporating it as part of the regurgitant jet.7 To avoid overestimating the regurgitant flow, color Doppler requires setting an appropriate Nyquist limit or sampling frequency of greater than 55 cm/second.
The apical 4-chamber and the parasternal long views are the best views to evaluate for mitral valve regurgitation in this patient with a likely flail leaflet. The color Doppler setting will provide a boxed in area for sampling. Adjust the box such that it encompasses the mitral valve as well as the left atrium. A smaller sampling box, will allow you to maximize the Nyquist limit. While there are many methods to quantify the severity of regurgitation, qualitative analysis is often more useful in the unstable patient. There are 2 qualitative clues that are consistent with acute severe regurgitation: jet shape and jet size. Regurgitant jets can form centrally or eccentrically. Eccentric jets are more often associated with flail leaflets and acute regurgitation.8 Typically, one jet will appear in the center of the atrium and the other will appear to hug the sidewall of the atrium. Resembling a flame-like structure across the mitral valve, the representation in Figure 5 is an example of a central regurgitant jet. Visual estimation of jet size is useful in determining severity of mitral valve regurgitation. Generally accepted jet size in severe regurgitation include a jet covering more than 40% of the left atrium (rough visual estimate) or a jet that reaches the back wall of the atrium.8
Integration of echocardiography into the hemodynamic assessment of the crashing patient provides an intervention-based, physiologic approach to resuscitation. While standard emergency medicine echocardiography can provide some answers to hemodynamic collapse, M-mode and Doppler techniques create a deeper understanding of the physiologic compromise of the patient in the resuscitation bay.
Special thanks to the NYU/Bellevue Department of Emergency Medicine for the echocardiographic images in this piece.
References
- Imazio M, Adler Y. Management of pericardial effusion. Eur Heart J. 2013;34(16):1186-97.
- Chandraratna PA, Mohar DS, Sidarous PF. Role of echocardiography in the treatment of cardiac tamponade. Echocardiography. 2014;31(7):899-910.
- Roy CL, Minor MA, Brookhart MA, Choudhry NK. Does this patient with a pericardial effusion have cardiac tamponade?. JAMA. 2007;297(16):1810-8.
- Otto CM. Practice of clinical Echocardiography: Expert consult premium edition - enhanced online features and print. 4th ed. Philadelphia, PA: Elsevier Health Sciences; May 15, 2012.
- Web.stanford.edu. (2017). Main Page - Echocardiography in ICU. [online] Available at: https://web.stanford.edu/group/ccm_echocardio/cgi-bin/mediawiki/index.php/Main_Page [Accessed 29 Sep. 2017].
- Parrillo JE, Dellinger RP. Critical Care Medicine, Principles of Diagnosis and Management in the Adult (Expert Consult - Online and Print). Elsevier Health Sciences; 2013.
- Armstrong WF, Ryan T, Feigenbaum H. Feigenbaum's Echocardiography. Lippincott Williams & Wilkins; 2010.
- Ma OJ, Mateer J, M.D. SA et al. Ma and Mateers Emergency Ultrasound 3/E (SET 2). McGraw Hill Professional; 2013.