Diagnosis -- “to know between.” It's something we do daily as medical care providers, especially in the emergency department as we are faced with a never-ending stream of undifferentiated patients. Each piece of their histories, along with the clues we uncover with our physical exams, laboratory results, and imaging, help point us in the right direction. However, diagnosis is not simply related to medical disease. Each year, graduating medical students are faced with the difficult task of figuring out which residency programs to apply to and, most importantly, how to rank each of the programs where they have interviewed. But perhaps an even more arduous task lies with the residency programs themselves, which often have to sift through thousands of applications to fill a dozen or so positions each year. As emergency medicine becomes an increasingly competitive specialty, how do programs diagnose — know between — their applicants, and vice versa?
The number of applicants and positions is increasing
In the 2014 NRMP Match, there were 1,786 positions offered by 170 residency programs for PGY-1 spots in emergency medicine — a number that has steadily increased from 1,472 positions offered by 141 residency programs in 2009 (prior to 2012, there were also PGY-2 starting positions in EM that were not accounted for in this data). The number of U.S. senior medical students and the total number of applicants appears to have roughly paralleled this increase (Figure 1).
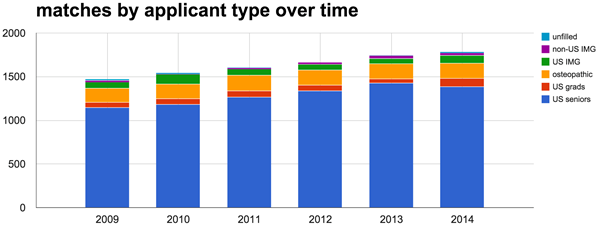
As displayed in Figure 2, the majority of NRMP EM Match positions have consistently been filled by U.S. (MD) seniors — roughly 75-80% in the past six years. However, there still appears to be room for osteopathic students and a handful of U.S. graduates (non-4th year) and U.S. citizen international medical graduates (U.S. IMGs). Opportunities are fewer for non-U.S. IMGs. Additionally, over the past six years, there has been an average of only 8.5 positions per year that weren't matched, including 2012, a year in which there were no unmatched spots.
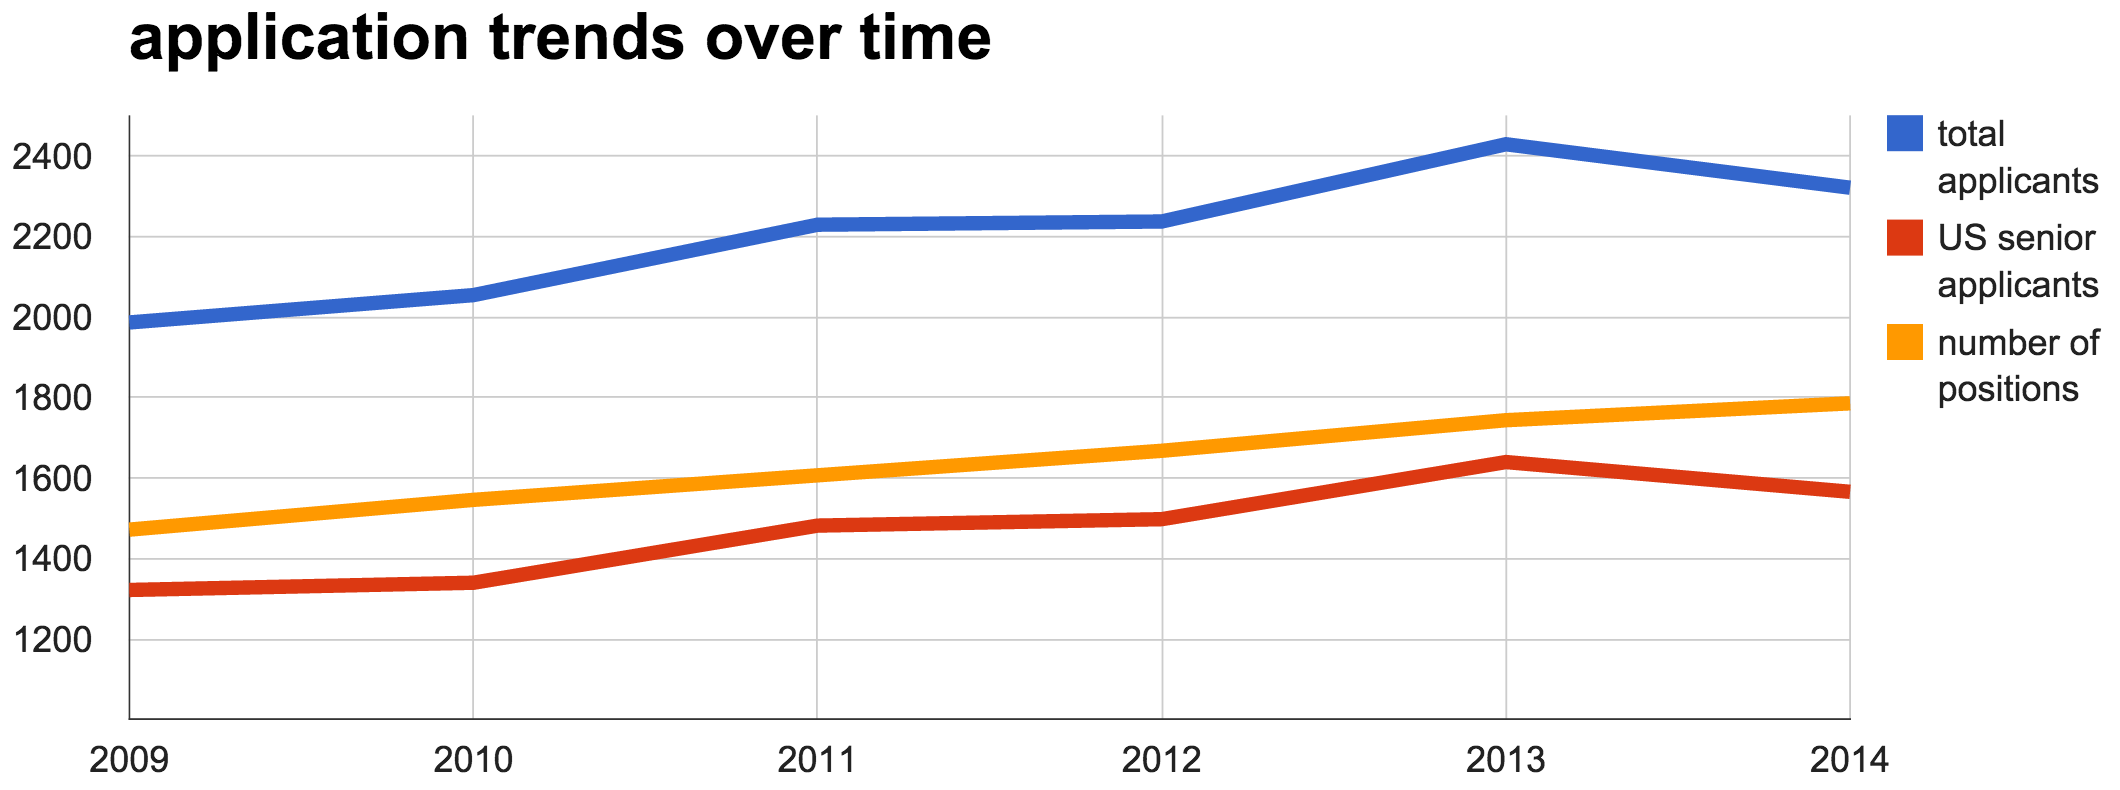
Figure 1. Number of PGY-1 Emergency Medicine positions, total applicants, and US senior (MD, 4th year) applicants in the years 2009 through 2014. Total applicants include US grads (non-4th year), osteopathic, US IMG, and non-US IMG types.
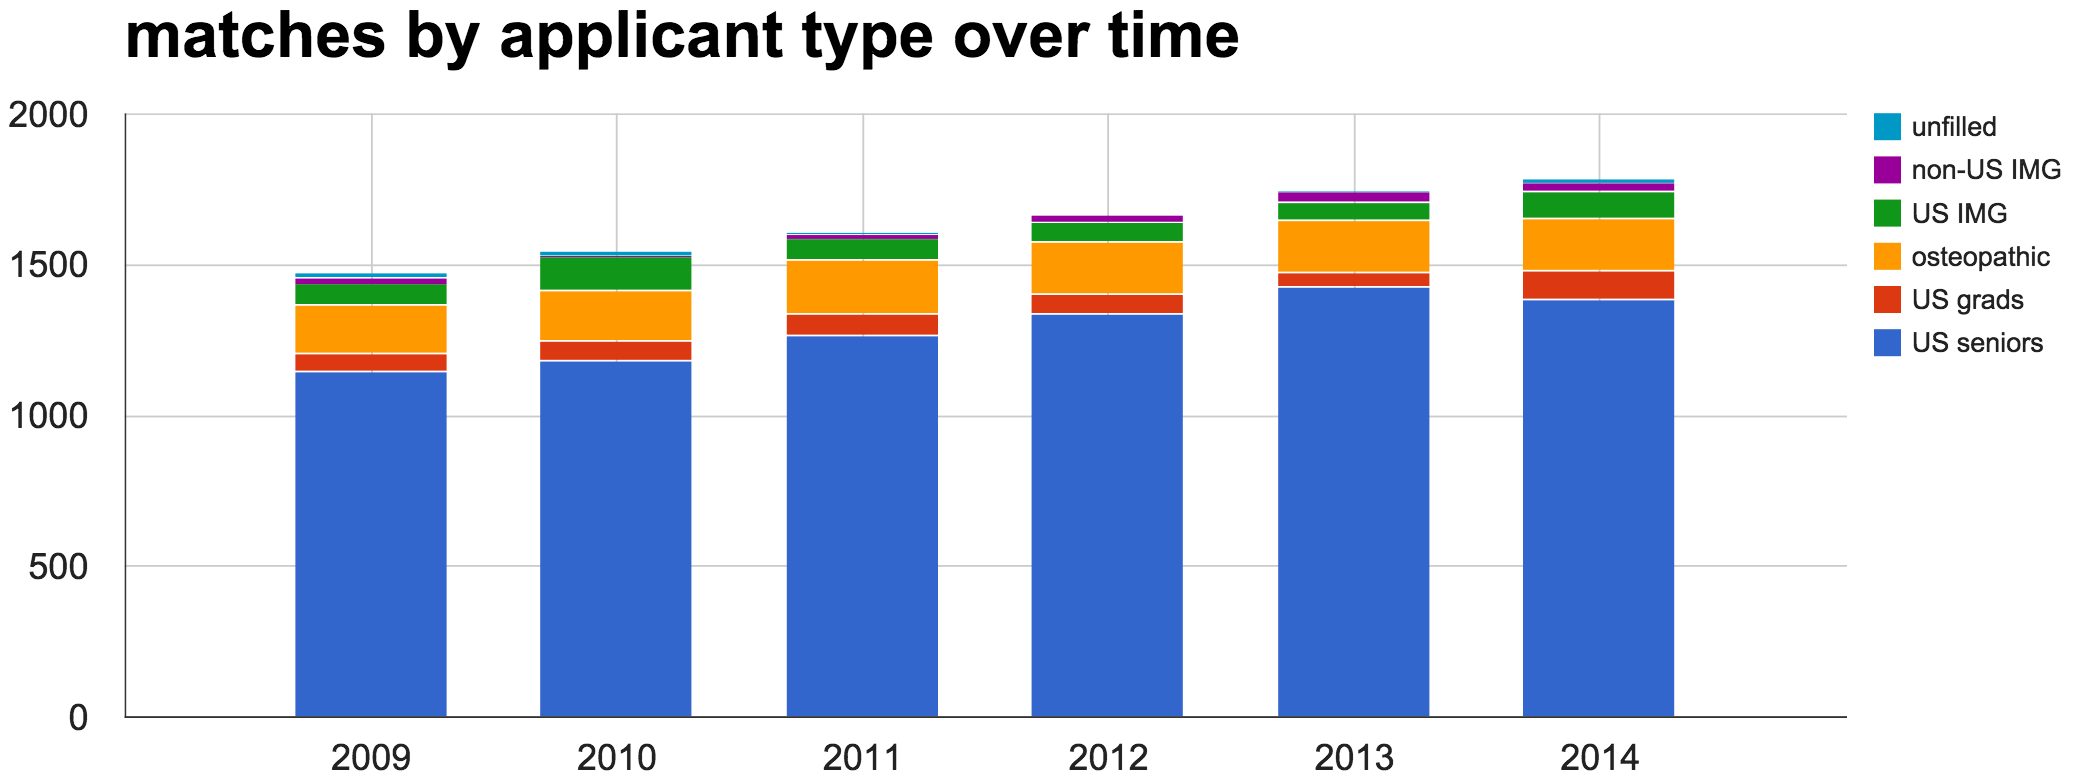
Figure 2. Total number of available PGY-1 positions and number of matches by applicant type over time. The non-US IMG category also includes a very small number (2-3) of Canadian and Fifth Pathway applicants each year.
The (over) application phenomenon
You probably applied to too many programs. We know you did, because everybody else did too. But what other choice did you have? This was the safe move. In 2009 and 2011, U.S. seniors who matched had a median of 26 applications to get a median of 17 interview offers. By 2013, the median number of applications had risen to 33 (a 27% increase) to get the same 17 interview offers. This trend has been even more substantial for the independent applicants (non-MD seniors) who matched. In 2013, they applied to a median of 40 programs and got a median of 8 interview offers (Figure 3).
Perhaps the picture is most grim for those who didn't match, where it appears that no matter how many applications those folks submitted, their chances of matching were seemingly insurmountable. Looking at the ratio of median number of applications to interview offers, it took unmatched independent applicants 25 applications to receive a single interview, compared to the 1.9 it took for matched U.S. seniors or the 5 it took for matched independent applications (see Figure 4).
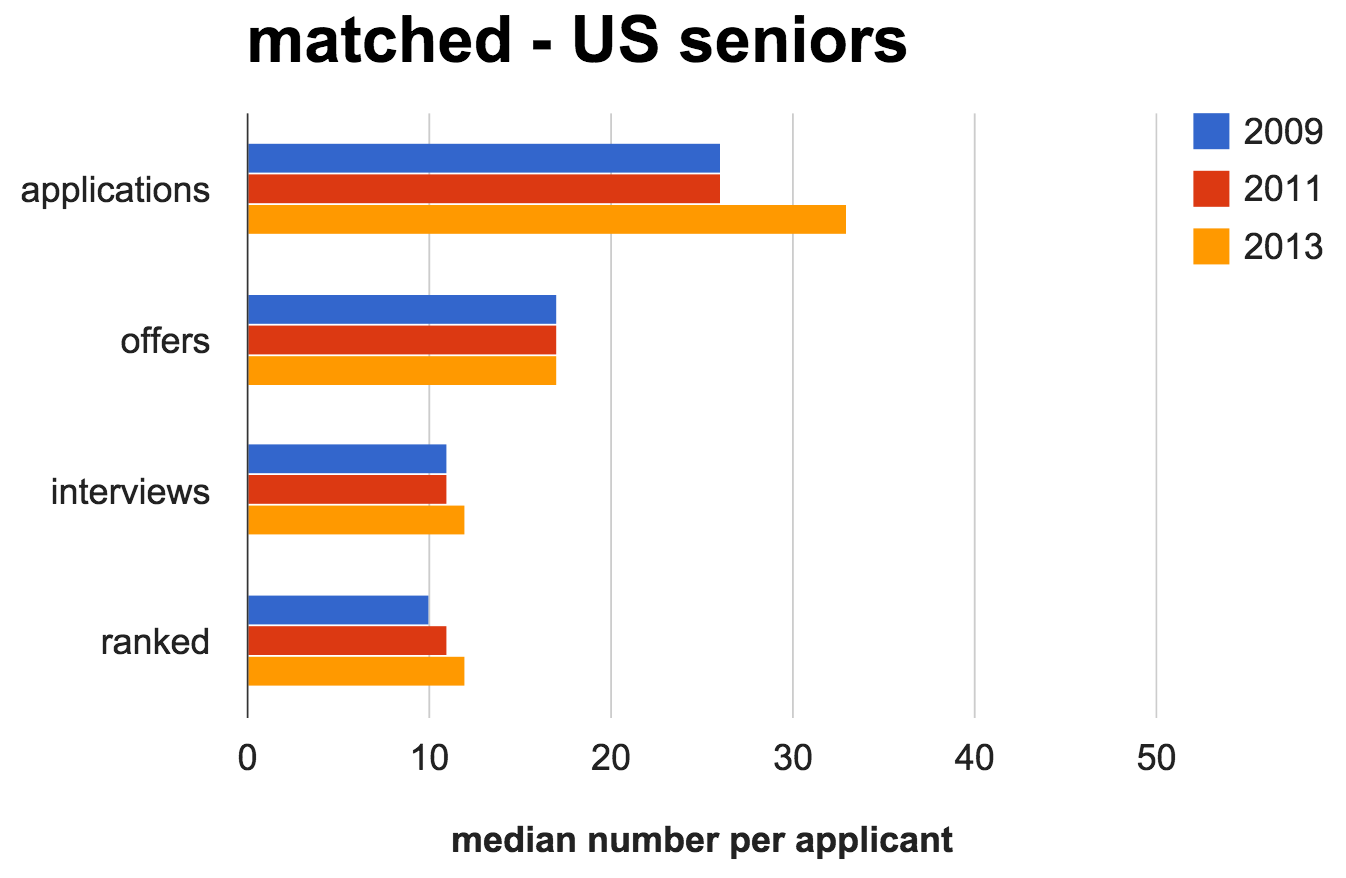
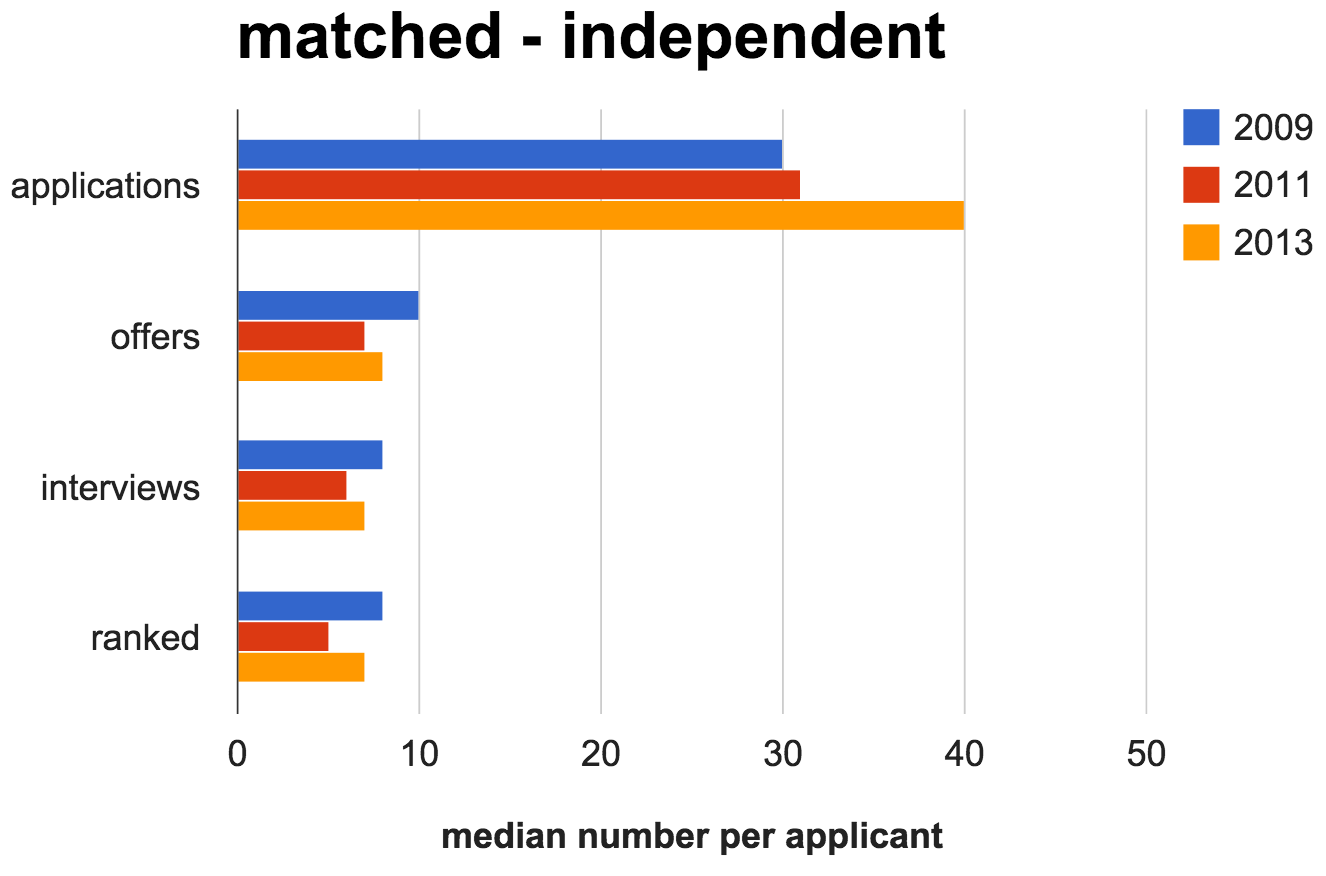
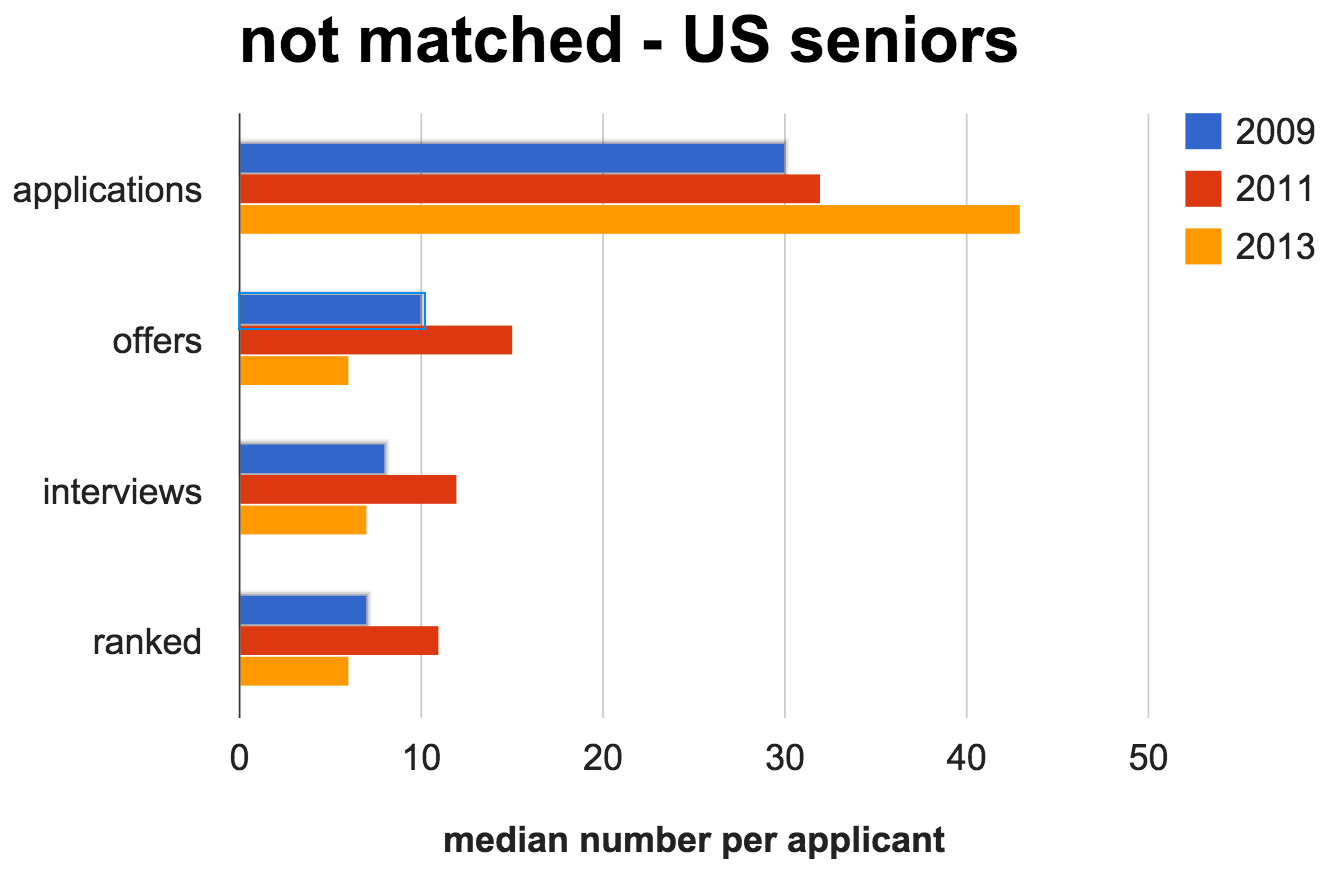
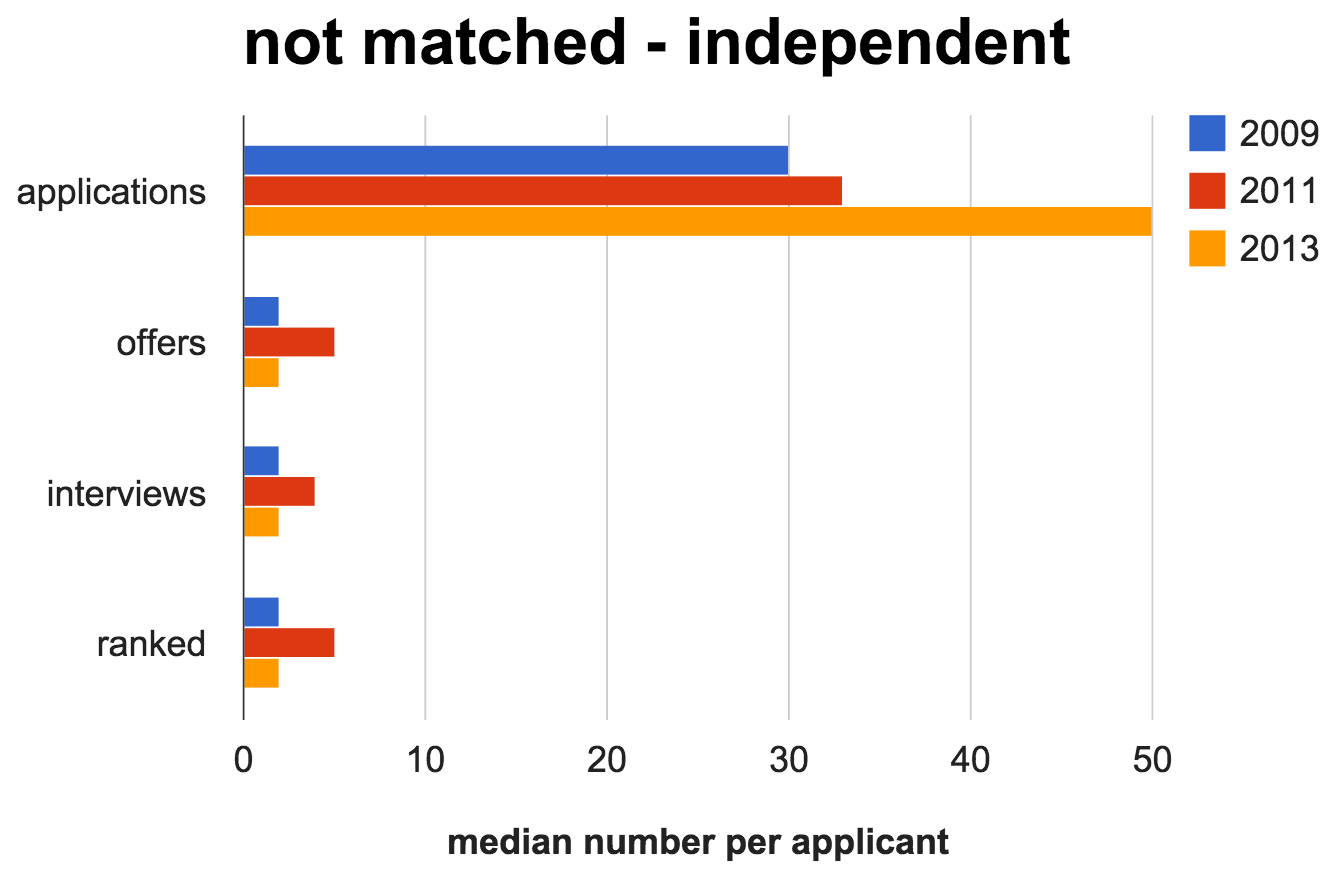
Figure 3. Median number of applications, interview offers, accepted interviews, and programs ranked by match status (matched vs. not matched) and applicant type (US seniors vs. independent applicants).
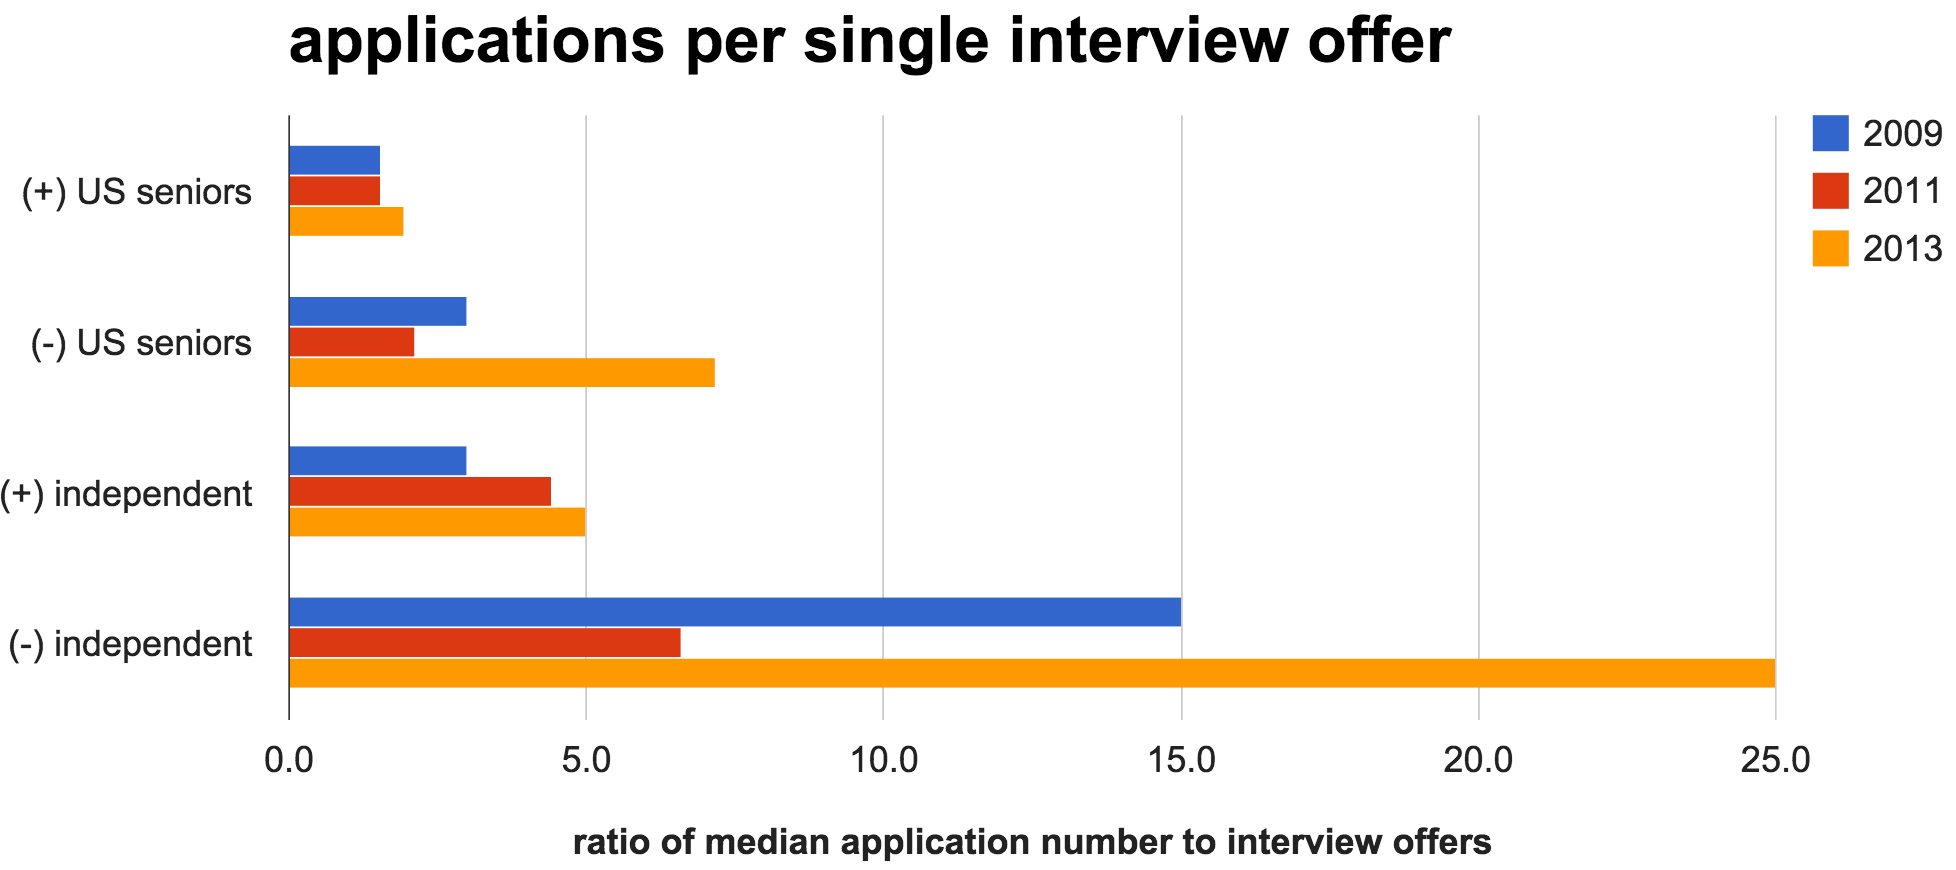
Figure 4. Trend in the ratio of the median number of applications per single interview offer by match status and applicant type. (+) = matched, (-) = unmatched.
The magic number is twelve
According to the NRMP's 2014 “Charting Outcomes in the Match” report,1 regardless of the number of applications you submit and interview offers you receive, what really determines your chances of matching is the number of programs that you rank after interview season. For U.S. seniors, ranking 12 programs is associated with a 99% chance of matching (ranking 7 programs gives you a 90% chance). Each interview completed and ranked after that does not increase your chances of matching (unless you are in a couples Match).
For independent applicants, ranking 12 programs is associated with a 95% chance of matching. Keep in mind that “Charting Outcomes” doesn't stratify by Match status, so if you're an independent applicant, don't be worried if you don't hit the magic number. As previously presented, the median number of programs ranked by matched independent applicants in 2014 was 7 (for all independent applicants, this represents an 80% chance of matching). Any program that brings you in for an interview wants to rank you on their list.
Most importantly, do not forget that the Match is still a student-weighted algorithm. For U.S. seniors applying to all specialties in 2014, 50% of students matched to their first choice program, and approximately three-quarters of students matched to one of their top-three program choices.
Program directors respond
At the 2014 Council of Residency Directors in Emergency Medicine (CORD; www.cordem.org) Academic Assembly, Drs. Diane Rimple and Michael Van Meter from the University of New Mexico Emergency Medicine Residency presented some enlightening survey data collected from faculty in residency program leadership positions. This shed some light on how each program is dealing with this unprecedented increase in the number of applications they are receiving.
The use of automatic filters
The rapid rise in the number of applications each residency program is receiving has not been met with a parallel increase in the number of program directors and other faculty available to review applications. At many programs, this has inevitably led to the increased use of automatic filters to reduce the number of applications subject to further consideration (see Figure 5).
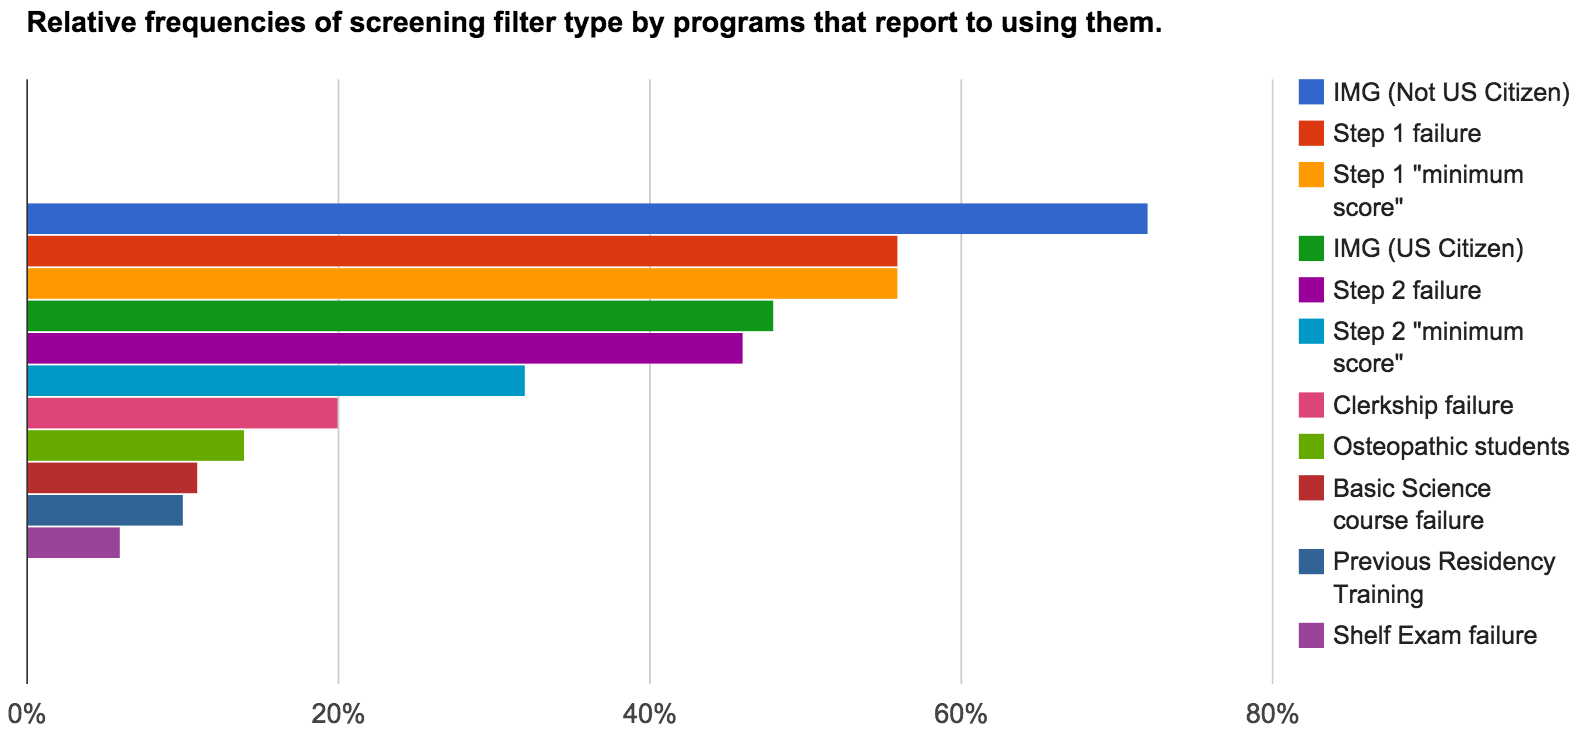
Figure 5. Relative frequency of filter type by the 55% of programs that report using automatic filters.
While most would not be surprised by the filters above, osteopathic students and IMGs will see that the matched numbers of these applicant types have been relatively stable. The programs not filtering are the ones that give them serious consideration (see Figure 6).
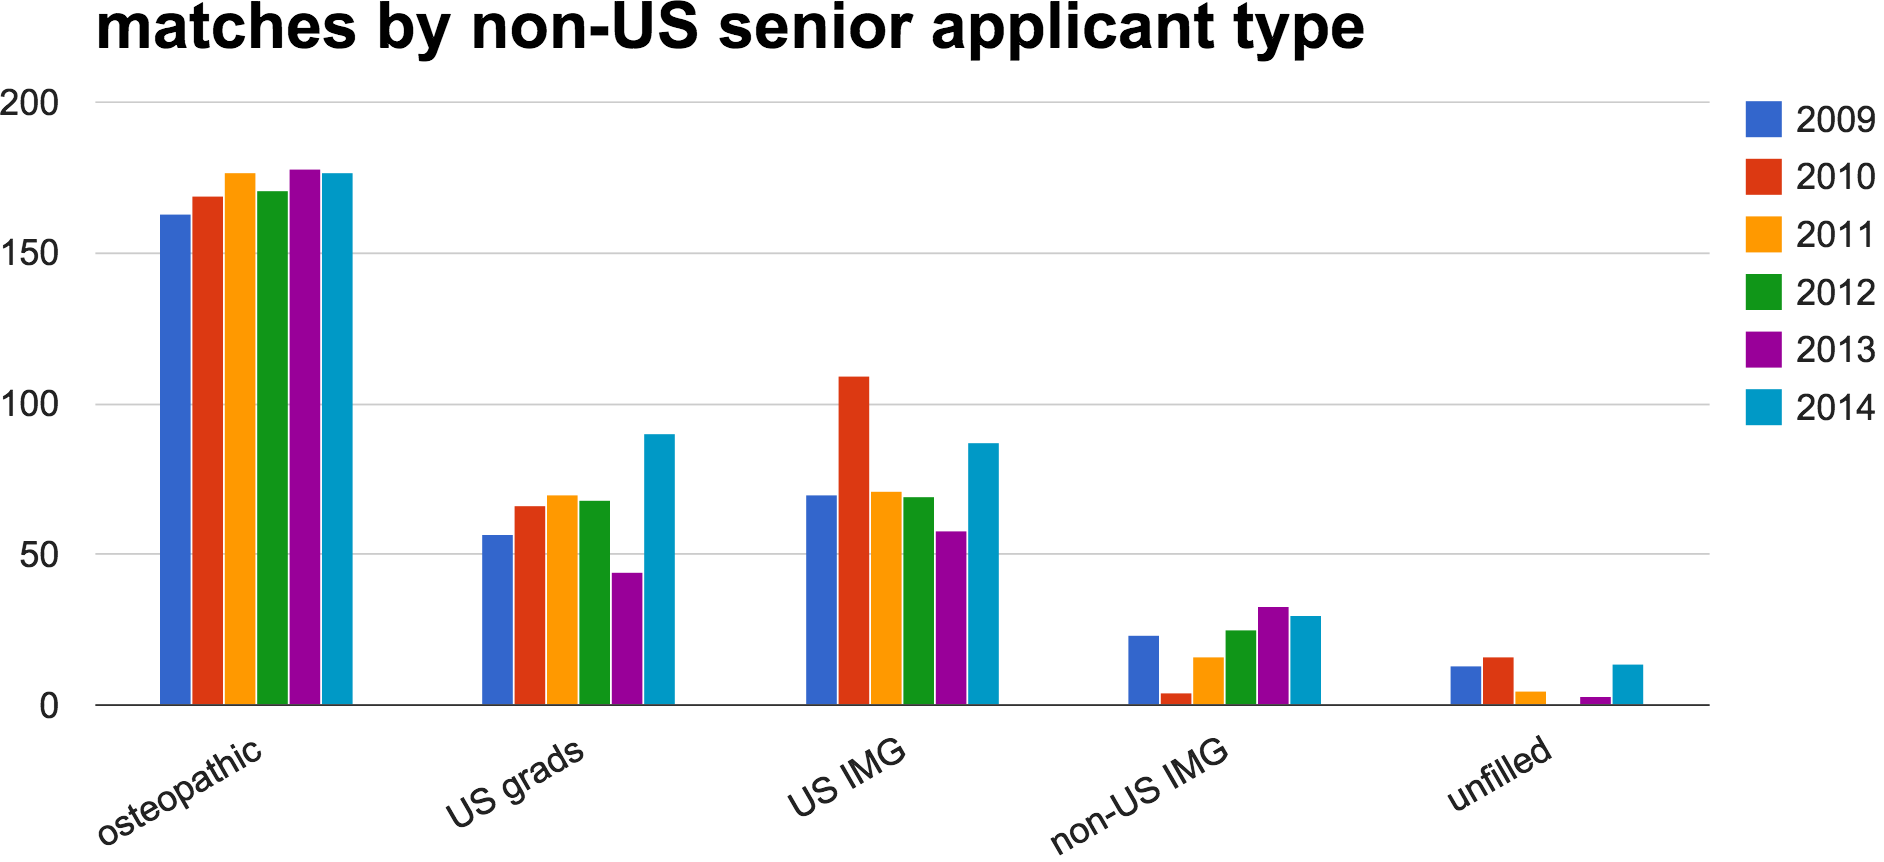
Figure 6. Number of matches by non-US seniors each year by applicant type. The non-US IMG category also includes a very small number (2-3) of Canadian and Fifth Pathway applicants each year.
The potential dangers of automatic filters
Screening might be efficient, but the filters used by each program are highly variable and can easily lead to arbitrary exclusion of otherwise competitive candidates. When we fail to recognize that applicants are more than the sum of their grades, the potential for collateral damage is real. Each program is looking for different qualities in their applicants. Even within the same program each member of the residency leadership can have different versions of the ideal candidate. And most also have their own ideas of what a “diamond in the rough” looks like as well.
For example, an otherwise “perfect” candidate, with great SLOEs and a 250 U.S. MLE Step 2 score, would not have their application reviewed by as many as 40% of programs if their Step 1 score was less than 210. This seems crazy. And it is. A Step 1 score may, or may not, end up being very important to program directors in creating their final rank list, but it is an easy, objective thing that can be screened to make the number of applications to review more manageable.
Assessing the situation
Roughly the same number of students are applying for the same number of positions. Opportunities remain for both MD seniors and independent applicants. The number of applications per student has gone up without a rise in the number of interviews offered. However, the majority of students already had more interviews than they actually needed once the whole process shook out. Programs are getting more applications and some are compensating by using automatic filters to screen applicants. This practice appears to have led to a smaller subset of applicants getting the majority of the early interview offers. The rest of the applicant pool are worried they won't get enough interviews. What can be done at this point?
What an applicant can do now
At this stage there is little you can change about your application and interviews are in full swing. If you find yourself in the group without enough interview offers there are still things that you can do.
- Don't panic. Most programs hold spots and/or work off a waitlist. There is a small group of students holding most of the interviews right now. As these fortunate folks sort out their schedules they will start cancelling/declining interviews, opening up spots for others. This is a rolling process. That median of 17 interviews was for the entire season, not for October and early November.
- Be available. It may be prudent to clear your January for short-notice interviews. These interviews count just the same as the ones done at the beginning of the season. Getting in the door is what matters, not when you do it.
- Show interest. To get those late opening interview spots you need to stand out from the rest of the applicant pool. You should politely contact a few programs that you are particularly interested in visiting. Contacting every program you have not heard from with a generic email is a waste of time. You need to have something to share with them that was not in your application. The best example is a local tie or connection that is not clear from the application. Other possibilities are a late arriving SLOE or that you are going to be in the area and would be available for any last minute openings.
- Make a back-up plan. Being an Emergency Physician is all about having back-up plans and being prepared. Start now. Using the SOAP process to get an EM spot is unlikely. If you have been advised that you are a borderline candidate, or you are not getting enough interviews, you should be making an alternative plan for what to do next year.
Lessons for next year: Apply strategically to avoid a competitiveness mismatch
The programs that use the most filters are likely those that get the most applications. From an applicant's perspective, this is probably the most important measure of a program's competitiveness. Gauging your own competitiveness can be difficult, even with the help of an experienced advisor. This is because programs have a huge variability in what they are looking for in an applicant. You may be the ideal “fit” for one program while getting no consideration from another. You can probably also make some educated guesses as to which programs get the most applications ”“ but these are still guesses. You are far better off applying to a diverse group of programs, in case your assessments of them or their assessment of you is off.
According to survey data collected by Rimple and Van Meter (2014), 55% of EM faculty have advised a qualified student who did not match into EM, but on the flipside 88% also report advising marginal students who successfully matched. The common reason for both? Strategic applying, or — in the case of the unmatched and qualified student — not applying strategically. Only 53% of students “ranked a mix of both competitive and less competitive programs.” Having both types of programs on your list will increase your likelihood of matching. Apply smarter; not harder.
References
- Rimple, D and Van Meter, M. “Advising to Match.” CORD Academic Assembly. New Orleans Marriott, New Orleans, LA, April 2014.
- National Resident Matching Program, Charting Outcomes in the Match, 2014. National Resident Matching Program, Washington, DC 2014.
- National Resident Matching Program, Data Release and Research Committee: Results of the 2009, 2011, 2013 NRMP Applicant Survey by Preferred Specialty and Applicant Type. National Resident Matching Program, Washington, DC. 2009, 2011, 2013.
- National Resident Matching Program, Results and Data: 2009, 2010, 2011, 2012, 2013, 2014 Main Residency Match ®. National Resident Matching Program, Washington, DC. 2009, 2010, 2011, 2012, 2013, 2014.


