


While there are a number of quantitative and qualitative assessments that can be used to evaluate right heart function, 2 measurements in particular can help differentiate acute versus chronic right heart failure.
Case
A 65-year-old female presents to the ED with shortness of breath for 2 days. She has a mild productive cough but denies fevers or chills. She reports a history of pulmonary embolism (PE) 10 years prior, for which she was treated, but cannot remember the details of her treatment. She has not established care with a PCP in over 20 years. She is a nonsmoker and occasionally drinks alcohol. Her vital signs are as follows: Respiratory rate is 25 BPM, pulse oximeter 92%, Temperature 99 F, blood pressure 130/90, and heart rate 115 BPM.
To help determine the etiology of her symptoms, you perform a bedside echocardiogram. You place the phased array (cardiac) probe in a parasternal long axis and upon obtaining an adequate image, you are concerned that her right ventricle (RV) is dilated, which suggests pulmonary embolism. Her lab results are significant for a creatinine of 2.7 mg/dL with an unknown baseline, mild troponin T elevation at 20 ng/L, and a white blood cell count of 13 x 109 cells/L. Chest X-ray demonstrates mild cardiomegaly and no obvious infiltrates. Because of her elevated creatinine, you are hesitant about ordering a CTPE study. The radiology technician tells you VQ scans cannot be done on the weekends and therefore this modality is not an option for you.
Where can you go from here? Her right ventricle dilation is concerning for a pulmonary embolism (PE) but given her history, she may also have chronic pulmonary hypertension or right heart failure from another etiology. Are there ultrasound findings that can help differentiate acute versus chronic right heart strain in this patient?
Overview
There are a number of ways to evaluate for right heart function using ultrasound. There are both qualitative and quantitative methods1. Commonly, qualitative or ‘eyeball’ methods are used. These qualitative methods include evaluating for RV dilation, for septal flattening, and for paradoxical septal motion1. To evaluate for RV dilation qualitatively, the most commonly used views are the parasternal long axis (PSLA) and the apical 4 chamber (A4) views. In the PSLA view, the RV size is compared to that of the aorta and the left atrium; all of which should be approximately equal in size (Figure 1). In the A4 view, the RV:LV ratio should be approximately 0.6:1. An RV:LV ratio >1:1 indicates RV dilation and should raise suspicion for elevated pulmonary pressures (Figure 2). Additionally, evaluating for septal flattening, or the ‘D’ sign, can be identified in the parasternal short axis (PSS) mid-papillary view (Figure 3). Paradoxical septal motion can be visualized in both the PSS, subxiphoid, and A4 views, caused by a dilated RV that bows into the LV during LV end diastole.
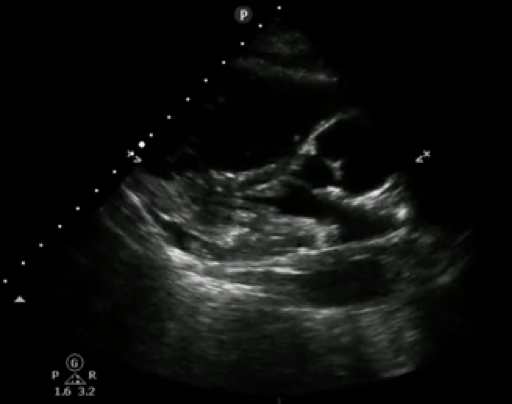
Figure 1. Parasternal long axis view demonstrating RV dilation. RV is notably larger than the ascending aorta and LA, which should normally appear approximately equal in size.
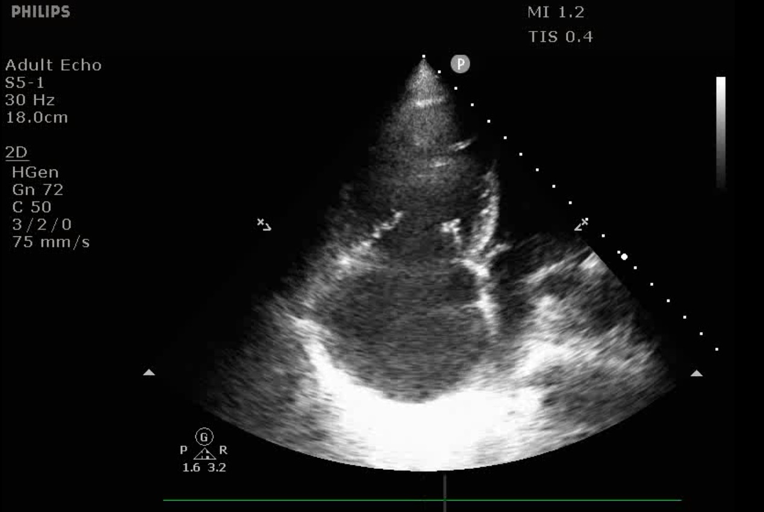
Figure 2. A4 view with RV enlargement. Note the left heart is only partially seen given size of the right heart. The RV: LV ratio is >1:1.
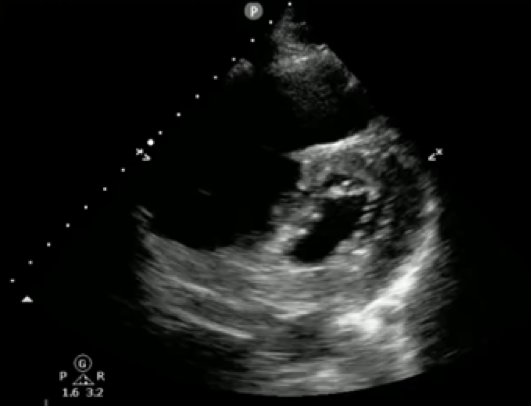
Figure 3. Parasternal short axis view demonstrating RV dilation and ‘D’ sign
There are also quantitative methods that can be used to evaluate right heart function.1 Quantitative size measurements include measuring the diameter and the area of the right ventricle, the area of the right atrium, and the thickness of the right ventricle.2 Right ventricle systolic function can be evaluated and is equally as important as the above listed measurements.2 Though not covered in depth here, Tricuspid Annular Plane Systolic Excursion (TAPSE), Systolic Excursion Velocity (s’), and Fractional Area of Change (FA) can be used to measure right heart systolic function. The presence and severity of tricuspid regurgitation is also important to evaluate. This value is needed to calculate right ventricular systolic pressure (RVSP) and pulmonary artery systolic pressure (PASP), in conjunction with Inferior Vena Cava (IVC) diameter as an estimate of right atrial pressure.
Acute vs Chronic RHF
There are a number of quantitative and qualitative assessments that can be used to evaluate right heart function. However, when specifically evaluating for acute versus chronic right heart failure, there are two measurements that can be useful in making this distinction. These measurements are right ventricular wall thickness and pulmonary artery systolic pressure (PASP); both of which were valuable in the diagnosis of the above-mentioned case.
RV Hypertrophy
Right ventricular hypertrophy is fairly easy to evaluate. Right ventricle hypertrophy occurs over time with chronically elevated PA pressures.1 RV hypertrophy is not typically seen in the setting of acute right heart failure.1
How to Diagnose RV Hypertrophy on ECHO
In a PSLA or subxiphoid view, measure the RV free wall from inside to outside in end diastole. A value > 5 mm likely indicates hypertrophy of the RV free wall. This is indicative of a more chronic process.2,3
A thickened RV > 5 mm should raise suspicion for chronic causes of right heart failure.1 An additional measurement that can help us differentiate acute versus chronic right heart failure is pulmonary artery systolic pressure (PASP).4,5 A PASP value < 35 mmHg is typically normal, and PASP of 40-60 mmHg can be indicative of pulmonary hypertension.2 A PASP ≥ 60 mmHg is generally consistent with longstanding pulmonary hypertension (PHTN). PASP ≥ 40 mmHg has been shown to be sensitive and specific when ruling in pulmonary hypertension.6 PASP can be estimated with echo by utilizing continuous wave (CW) doppler and knowledge of the modified Bernoulli equation.4
Measuring the Pulmonary Artery Systolic Pressure (PASP)
1. Using a phased array probe, obtain either an apical A4 or PSS axis view at the level of the tricuspid valve (TV). The key is to get good visualization of the TV.
2. Place a color doppler window over the TV and RA, looking for a tricuspid regurgitant (TR) jet (Figure 5).
3. Using CW doppler, align your doppler beam so it passes through the regurgitant jet.
4. Once the beam is aligned, toggle CW mode to spectral display (typically you’ll press the CW mode button a second time to toggle to this). (Figure 6)
- Your x-axis displays time, your y-axis displays velocity. Velocities greater than zero, indicate movement towards the probe, less than zero indicate movement away from the probe.
- Your TR velocity tracing will be negative indicating flow away from the probe. The tracing typically takes on a parabolic shape.
5. Measure the maximum TR velocity (V = VTR Max). (Figure 6)
6. Use the Modified Bernoulli equation (∆P=4VTR Max2) to calculate the pressure gradient (∆P) across the tricuspid valve.
- ∆P=4VTR Max2
7. RVSP is obtained by adding right atrial pressure (RAP) to ∆P. RAP is equivalent to central venous pressure (CVP)
- RVSP=4VTR Max2 + CVP
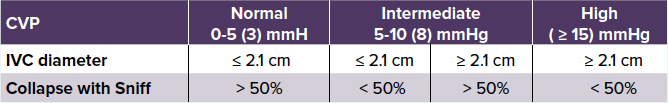
- Estimate CVP by measuring the diameter and respiratory variability of the IVC from the subcostal view2
8. Assuming no significant pulmonary valve stenosis exists, pulmonary artery systolic pressure (PASP) approximately equals RVSP. PASP ≈ RVSP
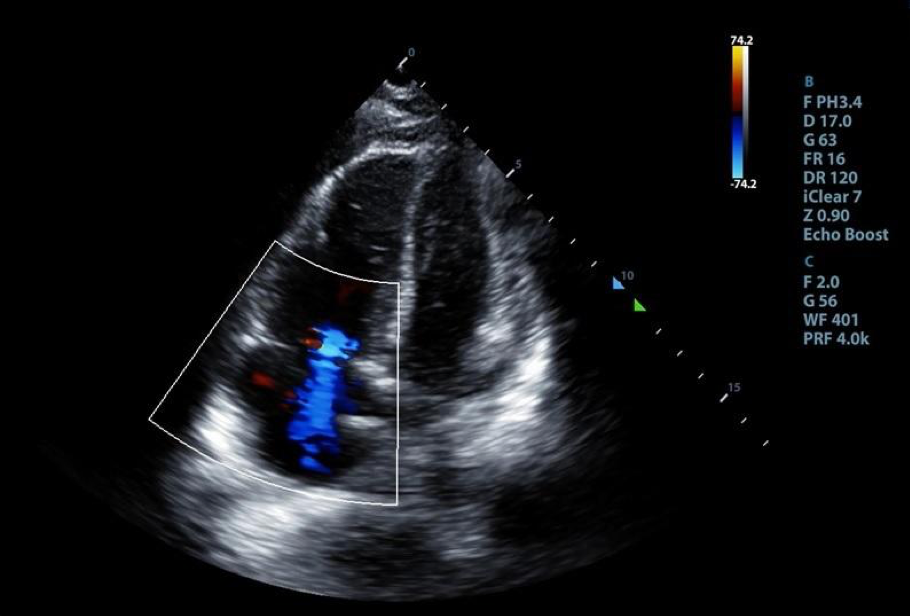
Figure 4. An A4 view with color doppler window centered over tricuspid valve demonstrating the presence of tricuspid regurgitation
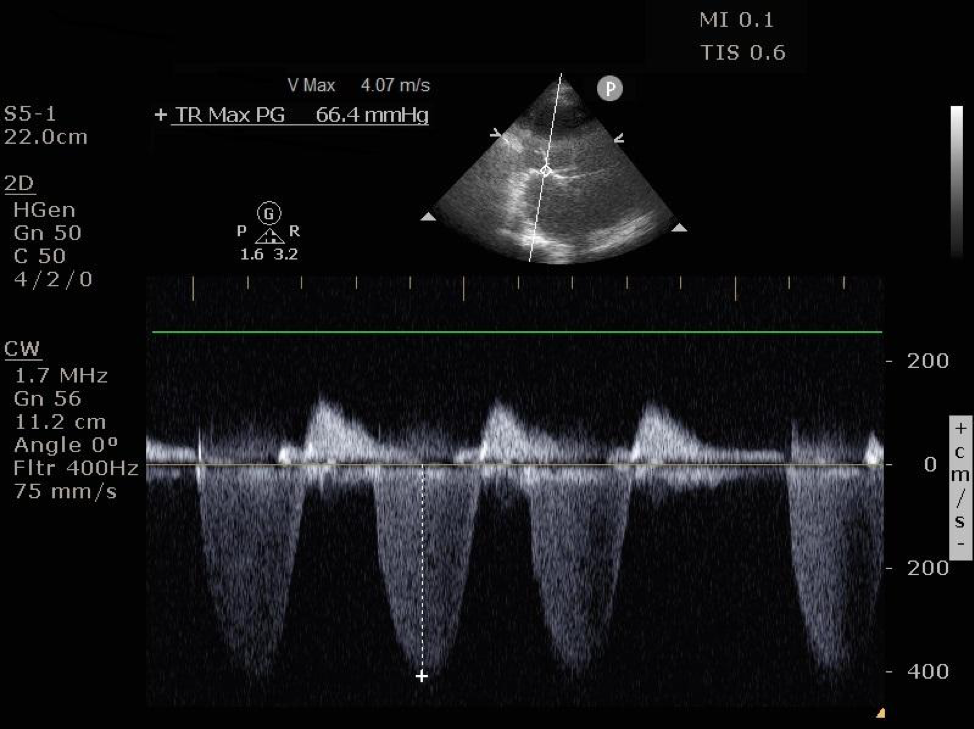
Figure 5. CW doppler spectral display of TV regurgitant jet velocity. Applying the modified bernoulli equation to the maximum velocity, VTR Max of 4.07 m/s, we see the pressure gradient (∆P) across the TV is 66.4 mmHg. Add CVP to obtain PASP.
Summary
Find the tricuspid regurgitant jet and measure the peak velocity (VTR Max). Estimate the pressure gradient (∆P)between the right ventricle and the right atrium using the modified Bernoulli equation (∆P =4VTR Max2). Add ∆P to the RAP to obtained the estimated PASP.
b. PASP = ∆P + RAP
c. ∆P = 4V2 = Pressure gradient across tricuspid valve (Modified Bernoulli equation)
d. V = VTR Max = Peak Tricuspid Regurgitant Jet Velocity
e. RAP ≈ CVP
• CVP ≈ IVC diameter/variability
- See IVC/CVP table2
Bonus: 60/60 Sign
After evaluating for RV hypertrophy and measuring the PASP, there is one additional evaluation that can help in determining acute versus chronic right heart failure. This evaluation is called the 60/60 sign and requires two values: the tricuspid insufficiency pressure gradient (∆P=4VTR Max2) and the Pulmonic Valve Acceleration Time (PAT).7 The PAT is the time interval from pulmonic valve opening until maximum blood flow velocity is reached. The tricuspid insufficiency pressure gradient measurement is described above in the calculation of PASP.
The PAT can be measured by first obtaining a PSS axis view at the level of the mitral valve. Once at this level, fan the probe towards the base of the heart (typically the tail of the US probe will fall towards the left hip) until the RV outflow view comes into plane. This view is characterized by visualization of the tricuspid valve, the pulmonic valve, and the “Mercedes Benz” shaped aortic valve. Place a pulse wave doppler (PW) gate centered over the pulmonic valve. Once the beam is aligned, toggle PW mode to spectral display (typically you’ll press the PW mode button a second time to toggle to this). To obtain the PAT, measure the time interval from the start of blood flow to its peak velocity.
The 60/60 sign suggests that if ∆P (= 4VTR Max2) and PAT are BOTH less than 60, acute causes of right heart failure are more likely. This is a positive 60/60 sign. One study demonstrated that in patients where acute PE was suspected, ∆P < 60 mmHg and PAT < 60 msec had a specificity and positive predictive value of 94% and 90% respectively for acute PE. Greater pressures and longer times, ∆Pand PAT > 60, were more commonly found in patients with chronic pulmonary hypertension.7
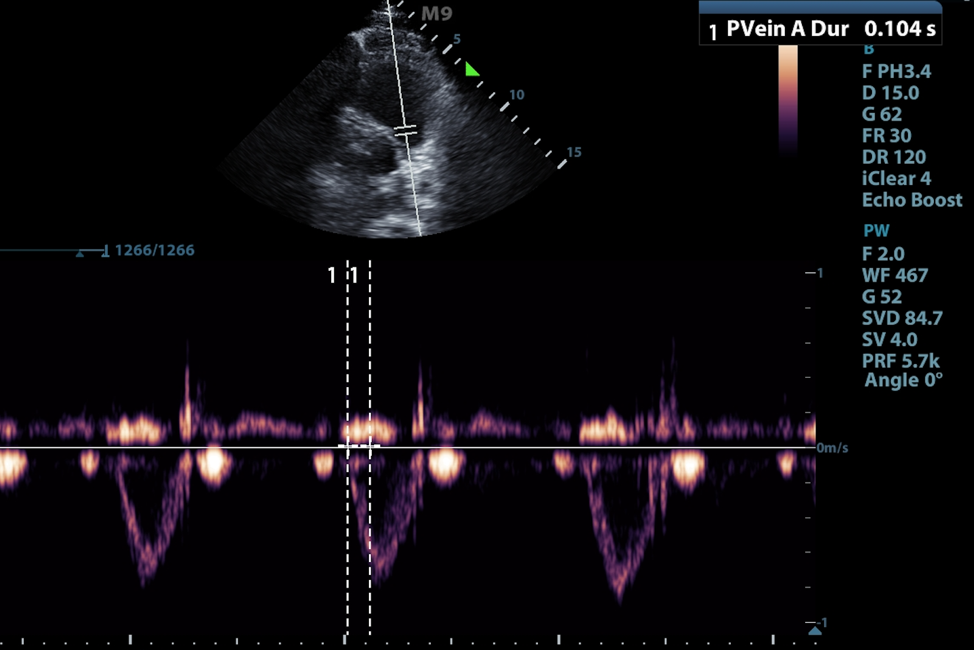
Figure 6. Measurement of pulmonary acceleration time in parasternal short RV inflow/outflow view. Note this example is normal with PAT > 104 msec.
Case Resolution
In our patient, her VTR Max was 4.07 m/s, thus ∆P was ~66.4 mmHg. CVP was 8 mmHg.
PASP = ∆P+ RAP
∆P = 4VTR Max2
PASP = 74.4 mmHg
TAPSE was also measured at 0.9 cm, indicating reduced RV systolic function (normal > 1.6 cm).8
In this acutely hypoxic patient with qualitative bedside ECHO views demonstrating right ventricular dilation and septal flattening, as discussed above, there are additional quantitative ultrasound findings that can help us differentiate acute versus chronic right heart failure. These include measurement of the pulmonary artery pressures, in conjunction with assessment of right ventricular wall thickness. Our patient had right ventricular wall thickness of 6 mm, TV gradient of 66.4 mmHg (∆P = 4VTR Max2) and PASP of 74.4 mmHg. Altogether, the values make chronic pulmonary hypertension and right heart failure, from her prior PE, the more likely etiology of her symptoms. Thrombolytics were not given and she was treated for acute decompensated pulmonary hypertension. Her symptoms improved while in the ED but she was admitted to the cardiology service for further monitoring.
Bottom Line
When differentiating acute versus chronic RV heart failure, think about using right ventricular hypertrophy, PASP, and the 60/60 sign. Keep in mind that there may be some exceptions but generally, RV hypertrophy > 5 mm, PASP > 60 mmHg, and negative 60/60 sign (PAT > 60 ms, ∆P > 60 mmHg) are generally consistent with chronic right heart failure.
References
1. Mikhalkova D, Quader N. Right Ventricular Function and Pulmonary Hemodynamics. In: Quader N, Makan M, Perez JE, The Washington Manual of Echocardiography. 2nd edition. Lippincott Williams and Wilkins, Wolters Kluwer; 2017, pp 55-71.
2. Rudski LG, Wyman WL, Afilalo J, Hua L, Handschumacher MD, Chandrasekaran K, Solomon SD, Schiller NB. Guidelines for the echocardiographic assessment of the right heart in adults: a report from the American Society of Echocardiography. J Am Soc Echocardio. 2010;23(7):685-713.
3. Ho SY, Nihoyannopoulos P. Anatomy, echocardiography and normal right ventricular dimensions. Heart. 2006;62:i2-i13.
4. Parasuraman S, Walker S, Loudon BL, Gollop ND, Wilson AM, Lowery C, Frenneaux M. Assessment of pulmonary artery pressure by echocardiography-a comprehensive review. Int J Cardiol Heart Vasc. 2016;12:45-51.
5. Smith B. Ultrasound of the Week Case 65. Accessed at https://www.ultrasoundoftheweek.com/uotw-65/
6. Bech-Hanssen O, Karason K, Rundqvist B, Bollano E, Lindgren F, Selimovic N. Can pulmonary hypertension and increased pulmonary vascular resistance be ruled in and ruled out by echocardiography. J Am Soc Echocardio. 2016;26(5):469-78.
7. Kurzyna M, Torbicki A, Pruszczyk P. Disturbed right ventricular ejection pattern as a new doppler echocardiographic sign of acute pulmonary embolism. Am J Cardiol. 2002;90(5):507-11.
8. Hickey S, Alerhand S. Tricuspid annular plane systolic excursion (TAPSE) for risk stratifying patients with pulmonary embolis. emDocs. August 2018. Available at http://www.emdocs.net/tricuspid-annular-plane-systolic-excursion-tapse-for-risk-stratifying-patients-with-pulmonary-embolism/